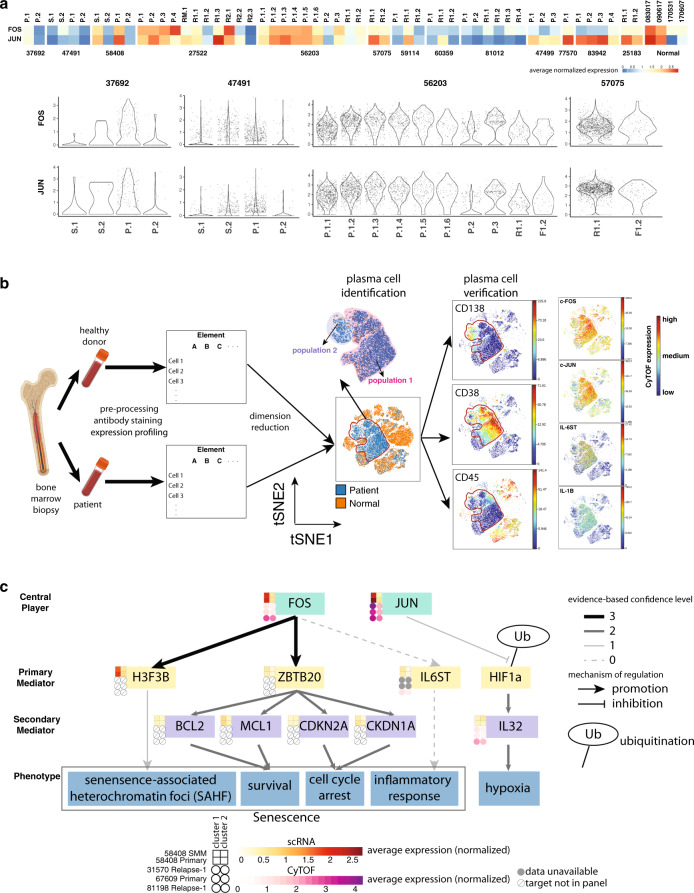
Fig. 7. AP-1 expression population in plasma cells confirmed by independent cohort.
a AP-1 components expression across plasma cell subpopulations across samples. Upper: average expression for FOS and JUN for each subpopulation. Lower: violin plot showing the expression patterns of FOS and JUN for some cases of interest. S SMM, P Primary, RM Remission, R1 Relapse-1, R2 Relapse-2. b CyTOF experiment workflow and data analysis. Bone marrow samples from patient and healthy donors are preprocessed, stained for target antibodies of interest, and expression is profiled in parallel. Samples from patients and healthy donors are merged together and visualized with t-SNE. Regions where only patient samples occupy are further checked for CD138, CD38, and CD45 for verification of their plasma cell identity. Expression profile for FOS, JUN, IL-1B and IL-6 within plasma cells are shown. c. Proposed mechanism of how AP-1 complex influences the phenotype of myeloma cells. Heatmap beside each gene indicates normalized expression for different populations of plasma cells in Patients 58408 (SMM and Primary), 31570, 67609, and 81198. scRNA-seq expression data, yellow scale; CyTOF expression data, purple scale. Solid arrows indicate the presence of evidence from literature or database. Dashed arrows indicate indirect evidence. Color of solid arrows indicates the confidence level of the evidence of origin. 3, evidence from ChIP-seq database; 2, evidence from myeloma associated literature; 1, evidence from non-myeloma associated literature. Clusters 1 and 2 for each case are manually defined.

