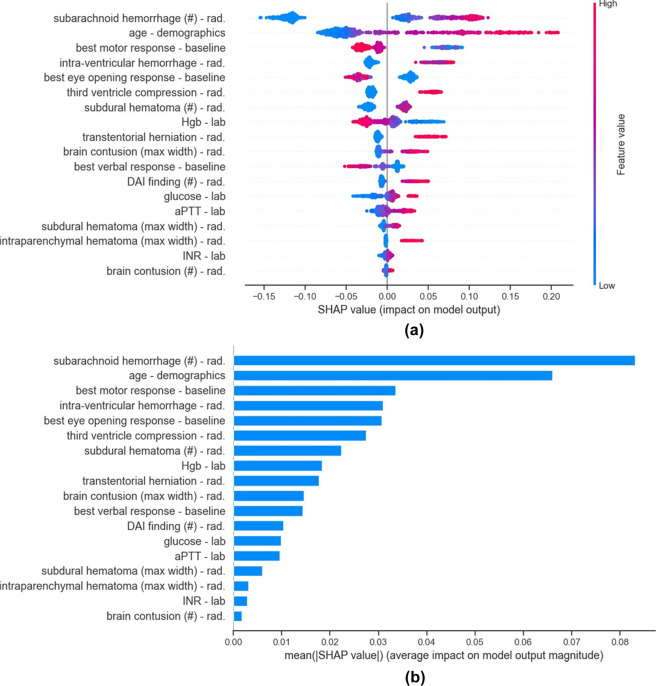
Fig. 3. Summary of the SHAP contributions in the final model.
a Shows the summary plot of the contribution of all 18 variables in the final model. Each point corresponds to one patient, while color corresponds to the value of the variable, with the spectrum from blue to pink associated with low to high values. b Shows variables in order of their importance, where importance of a variable is defined by the average of the absolute SHAP values. Variable types are denoted as rad: radiology report and lab: laboratory value.

