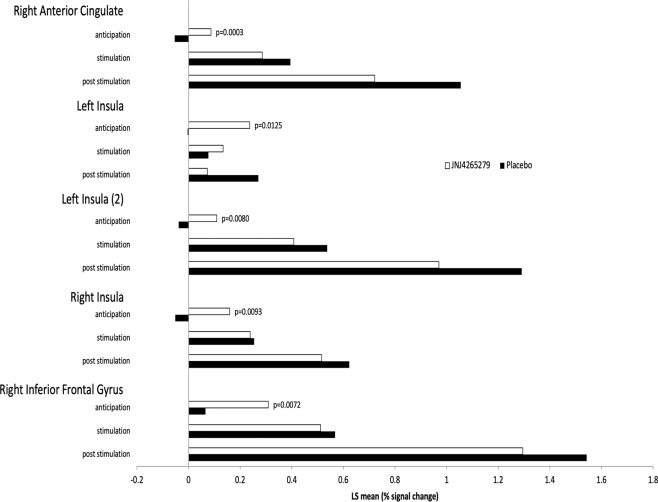
Fig. 2. MRI breathing load task—subregions of interest (by condition): LS mean values.
Numbers represent BOLD fMRI Talairach-transformed percent signal changes. Data represent averages over trials. p values are based on test for no difference between treatments from a mixed effects ANOVA model with condition as within-subject factor and treatment (placebo, JNJ-42165279) as between-subject factor.

