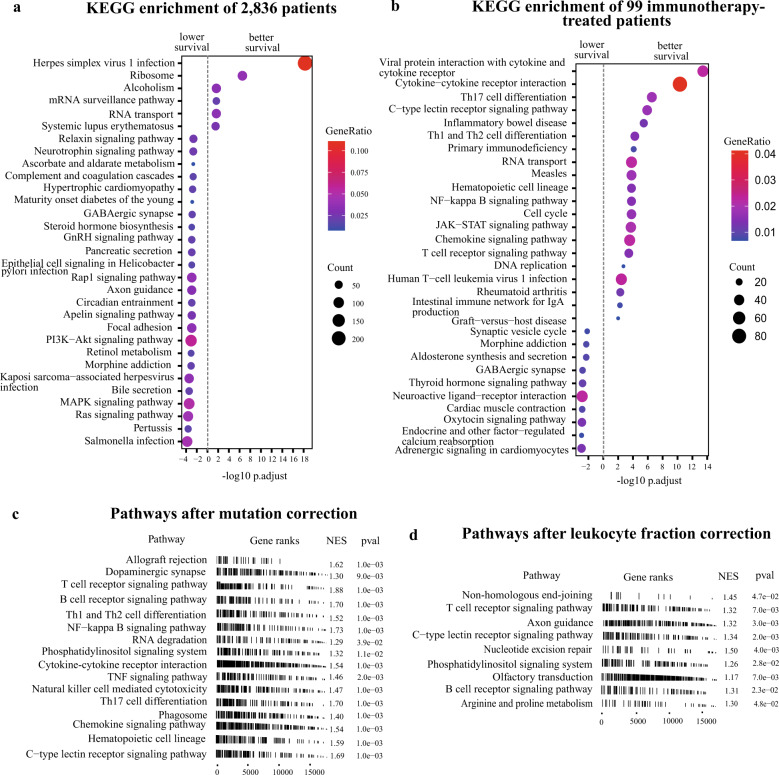
Fig. 2. Pathways of response to immunotherapy.
a KEGG enrichment of genes of which higher expression were associated with lower (left) or better (right) survival of all 2836 patients for which clinical information was available based on expression profile without any correction (log-rank test, FDR adjusted p-value < 0.05). b KEGG enrichment of genes of which higher expression were associated with lower (left) or better (right) survival of 99 patients receiving immunotherapy based on expression profile without any correction (log-rank test, FDR adjusted p-value < 0.05). c, d Pathways associated with immunotherapy-specific responses based on “mutation correction” profile (c) and “leukocyte fraction correction” profile (d). Only pathways with a statistically significant importance score after feature selection are shown here.

