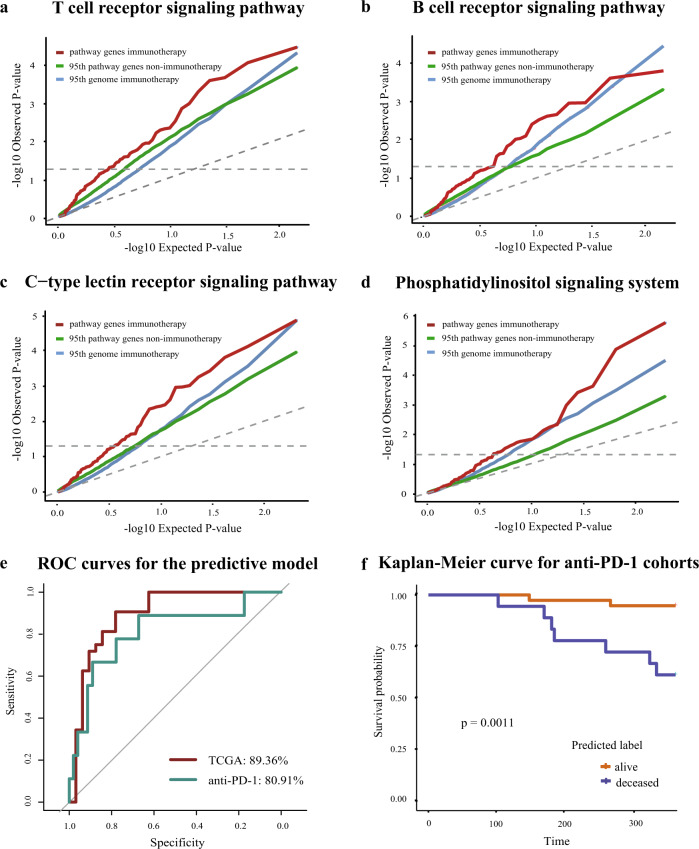
Fig. 3. The gene panel from four pathways predicts patient survival following immunotherapy.
a–d Quantile–quantile plots showed that the p-value distribution in the survival analysis of pathway genes in patients treated with immunotherapy (red line) was more significant than that of patients treated with other therapies (green line). The 95th percentile of p-value from the survival analysis of random genome after immunotherapy was plotted as the background control (blue line). e Performance of the logistic regression model built with the 40 IPMGs in different cohorts. f Kaplan–Meier plot shows a significant difference in survival (the log-rank test, p-value < 0.05) between alive and deceased groups predicted by the elastic net logistic regression model in the anti-PD-1 therapy-treated cohorts.

