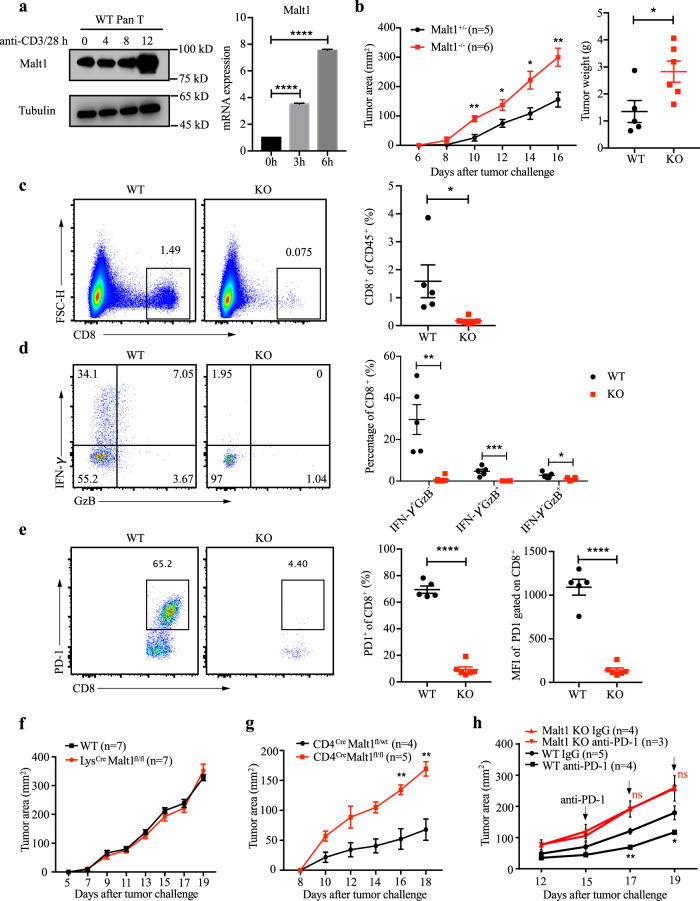
Fig. 5. MALT1 plays a profound role in the immune rejection of tumor cells and the response to the anti-PD-1 therapy.
a WT Pan T cells were stimulated by plate-bound anti-CD3/28 (5 μg/ml) for the indicated time points. The Malt1 protein level (left) and mRNA level (right) was detected by WB or qPCR, respectively. b Tumor cells were inoculated subcutaneously in Malt1+/− and Malt1−/− mice. Tumor growth was measured using calipers at indicated time points and tumor weights were calculated at the end stage. c The percentage of CD8+ T cells in the tumor-infiltrated lymphocytes (TILs) gated on CD45.2+. d The percentage of IFN-γ- and Granzyme B-producing CD8+ T cells gated on CD8+ cells. e The FACS plot of PD-1-expressing CD8+ T cells gated on CD8+ cells, and statistical results of PD-1+CD8+ percentage and mean fluorescence intensity (MFI) of PD-1 expression on CD8+ T cells. f Tumor growth in LysCre/Malt1fl/fl and control mice. g Tumor growth in CD4Cre/Malt1fl/fl and control mice. h Tumor growth in mice treated with anti-PD-1 antibody or IgG control. Statistical analysis was performed by unpaired Student t-test and the error bars represent ± SEM. *p < 0.05, **p < 0.01, ***p < 0.001, ****p < 0.0001. These results are from one representative experiment of three independent biological replicates.

