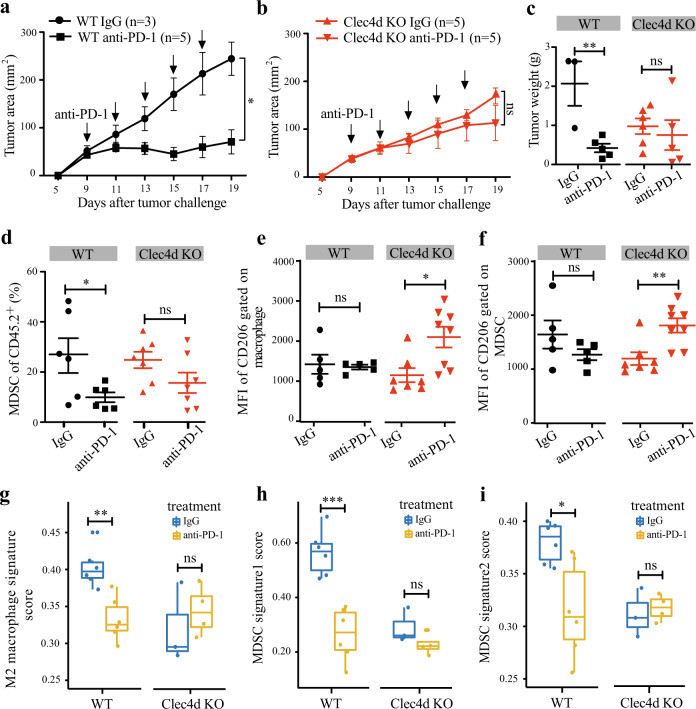
Fig. 6. CLEC4D affects tumor response to the anti-PD-1 therapy.
a–c WT and Clec4d−/− mice (a, b) were implanted subcutaneously with tumor cells. Tumor growth in mice treated with anti-PD-1 or IgG control was measured at indicated time points. Tumor volumes for the last time point were also shown (c). d The percentage of MDSC in the TIL gated on CD45.2+. e, f The MFI of CD206 on macrophages (e) and MDSCs (f) in relative subpopulations. g The mean expression of signature genes for M2 macrophages from a previous study45 in indicated groups. h, i The mean expression of MDSCs signature genes from previous studies (h) and CellMarker database (i) in indicated groups. Statistical analysis was performed by unpaired Student t-test and the error bars represent ±SEM. *p < 0.05, **p < 0.01, ***p < 0.001. Data from one representative experiment of three independent experiments is shown.

