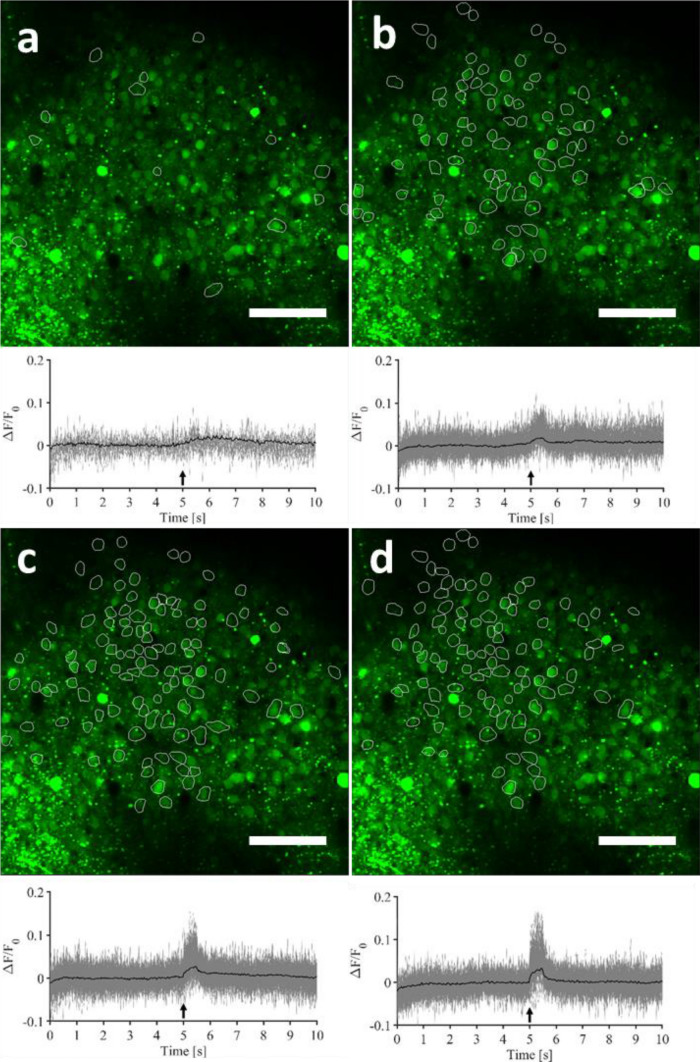
Figure 3.
Representative two-photon field-of-view of a single mouse visual cortical area showing identified responsive cells, as well as their individual GCaMP6f fluorescence time courses (grey—average over 5 repetitions) and the grand-average GCaMP6f fluorescence time course, i.e. the 5-trial average, averaged over all the responding cells (black). (a) 0.35 J cm−2. (b) 0.47 J cm−2. (c) 0.58 J cm−2, and (d) 0.70 J cm−2. Scale bar: 100 µm. For the criterion used to class a cell as responsive or not, see Fig. 2c,d and “Methods”. This figure is modified from36, as the pictures have already been published in early work in a proceeding of SPIE Photonics West (figure created from MESc software and Matlab R2018b).

