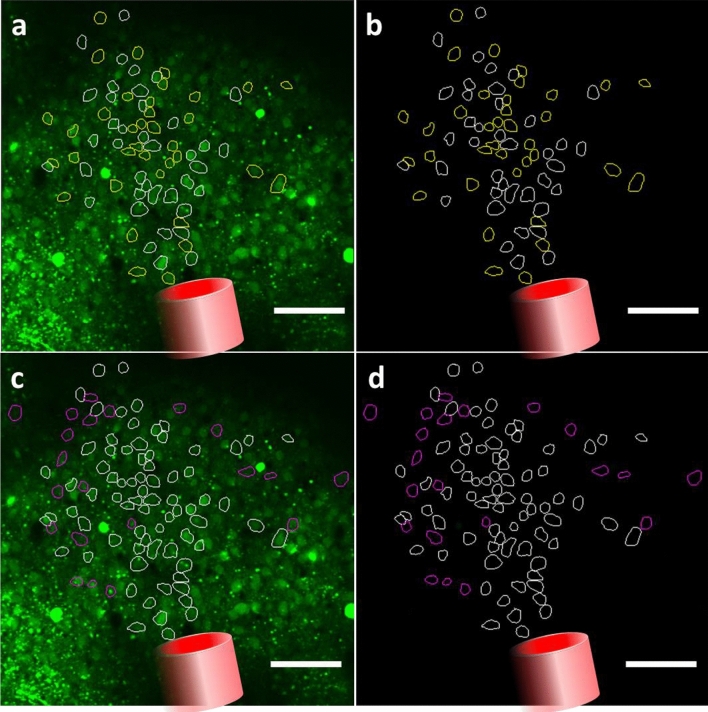
Figure 5.
Representative two-photon field of view of a single mouse visual cortex showing responsive identified cells (a,b) Cells responding to 0.47 J cm−2, 0.58 J cm−2 and 0.70 J cm−2 in white and responding to 0.58 J cm−2 and 0.70 J cm−2 in yellow. (c,d) Cells identified in (a). in white and cells responding to only 0.70 J cm−2 in magenta. (a–d) Red cylinder represents the schematic view of the projection of the optical fiber transferring infrared light to the tissue. Scale bar: 100 µm (figure created from Powerpoint 2016 and MESc software).

