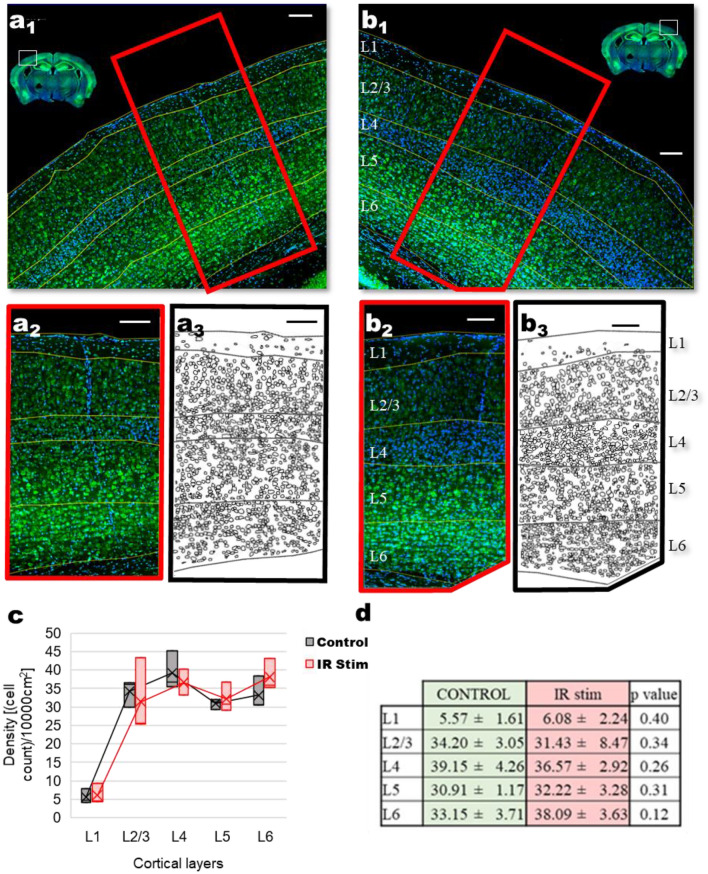
Figure 9.
Confocal image of stained nuclei (DAPI staining; blue) and cell bodies (NeuroTrace green fluorescent Nissl staining, green) of (a1) control (non-irradiated) and (b1) infrared-irradiated mouse brain hemisphere. Control area (a2) corresponding to the (b2) localized IR-irradiated area, used for the detection of cell bodies. Identified cell bodies in (a3) control and (b3) irradiated area. (c) Box plot of cell density values per 0.1 mm2 for control and IR stimulation hemispheres. (d) Cellular density values (number of cells per 0.1 mm2; mean ± SD) for cortical layers in control and IR stimulation hemispheres, showing no significant difference (t-test, N = 3 mice). Scale bar: 100 µm (figure created from Excel 2016, Powerpoint 2016 and ImageJ).

