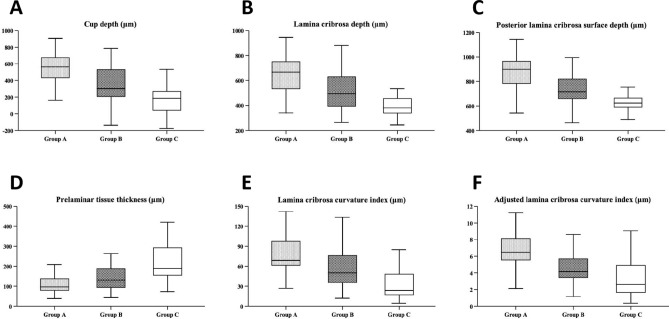
Figure 2.
Box diagram of related parameters of lamina cribrosa between three groups (A–F) showed the overall distribution of CD, LCD, PLCSD, PTT, LCCI and aLCCI among the three groups, respectively. From the comprehensive depth index (A–C), group A (IOP ≥ 30 mmHg) was significantly deeper than Group C (Normal control), and followed by group B (21 mmHg ≤ IOP < 30 mmHg), and the same performance was shown in curvature index (E,F). In the PTT (D), the performance of the three groups was opposite to that of the anterior index, that is, PTT with group A (IOP ≥ 30 mmHg) was significantly thinner.

