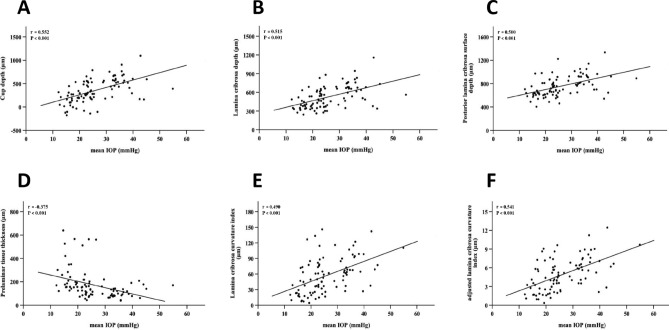
Figure 3.
Linear regression analysis between different IOP levels and related parameters of lamina cribrosa. (A–F) showed the linear correlation between different IOP levels and CD, LCD, PLCSD, PTT, LCCI and aLCCI, respectively. The results show that there is a significant linear relationship between different IOP levels and these six parameters (P < 0.001), and the IOP level is positively correlated with the changes of CD, LCD, PLCSD, LCCI and aLCCI, but negatively correlated with PTT.

