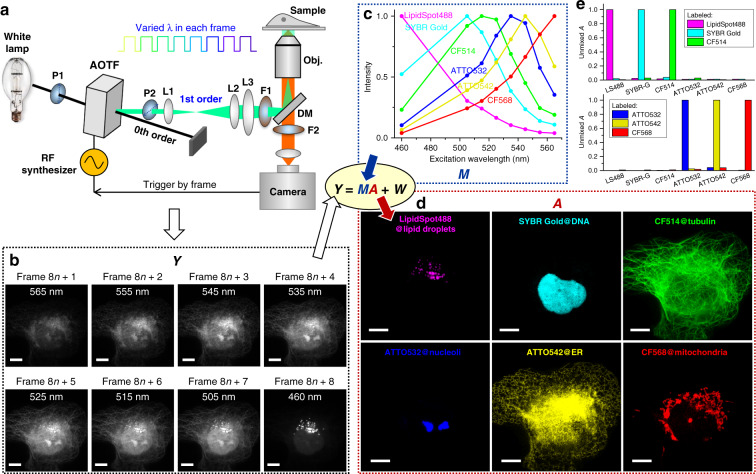
Fig. 1. Excitation spectral microscopy.
a Schematic of the setup. Full-frame spectral micrographs are obtained by the synchronized fast modulation of the excitation wavelength λ in consecutive frames. P polarizer, L lens, F bandpass filter, DM dichroic mirror. The resultant excitation spectrum collected at every pixel (Y) is linearly unmixed into the abundances (A) of different fluorophores based on their pre-calibrated excitation spectrum (M) to minimize the residual (W). b Example images recorded at eight preset excitation wavelengths in eight consecutive frames at 10 fps (thus 0.8 s total data acquisition time), for a fixed COS-7 cell labeled by six fluorescent dyes for six distinct subcellular structures: LipidSpot 488 for lipid droplets, SYBR Gold for nuclear DNA, and CF514, ATTO 532, ATTO 542, and CF568 for immunofluorescence of tubulin, nucleoli, the endoplasmic reticulum (ER), and mitochondria, respectively. c Eight-wavelength excitation spectra of the six fluorophores, separately measured on our setup using singly labeled samples. d Decomposed images of the six fluorophores, obtained via linearly unmixing the excitation-dependent intensity at each pixel in b using the reference spectra in c. e Unmixed abundancy values in different fluorophore channels for samples singly labeled by each of the six fluorophores. Scale bars: 10 µm (b, d)

