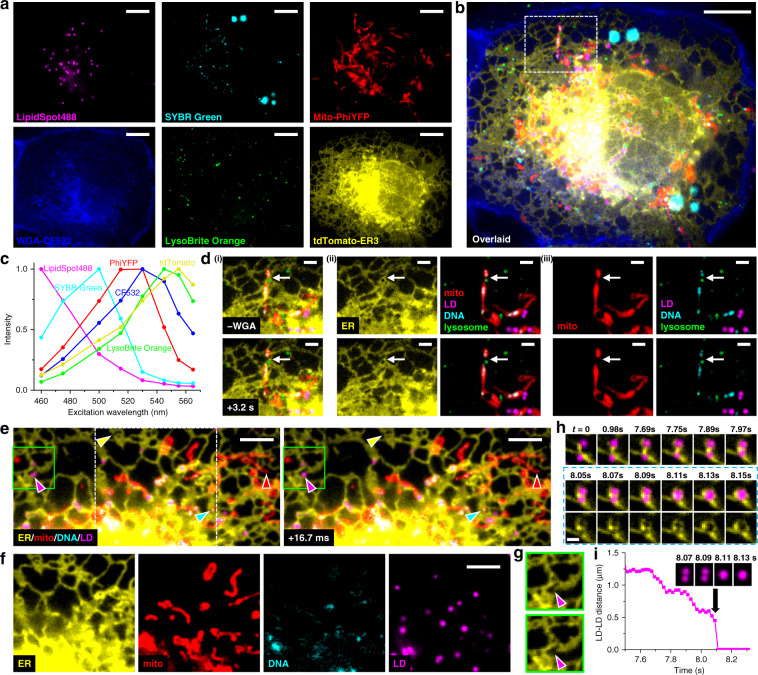
Fig. 2. Fast multitarget imaging of live cells.
a Unmixed images of six subcellular targets in a live COS-7 cell via 8-excitation-wavelength recording at 10 fps (0.8 s total data acquisition time). LipidSpot 488: lipid droplets (LDs), SYBR Green: mitochondrial DNA, Mito-PhiYFP: mitochondrial matrix, WGA-CF532: cell membrane, LysoBrite Orange: lysosomes, tdTomato-ER3: ER. b Overlay of the above six images. c Reference excitation spectra of the six fluorophores, separately measured on the setup using singly labeled samples. d The box region in b for two time points 3.2 s apart (top vs. bottom rows), after i) removing the WGA channel, ii) separation of the ER channel, and iii) further separation of the mitochondria channel. e Two consecutive 4-fluorophore images at 16.7 ms time spacing for another live COS-7 cell labeled by tdTomato-ER3, Mito-PhiYFP, SYBR Green, and LipidSpot 488, achieved by synchronizing 4-wavelength excitation with 240 fps recording. Yellow, red, cyan, and magenta arrowheads point to noticeable structural changes in each fluorophore channel. f The separated fluorophore channels for the white box in e. g The ER channel for the green boxes in e, at 16.7 ms separation. h ER-mediated LD fusion observed in another 4-wavelength experiment at 19.8 ms time spacing (202 fps recording). Bottom row: consecutive ER-LD and ER images during merging. i Distance between the two LDs as a function of time. Inset: four consecutive images of the LD channel. Scale bars: 10 µm (a, b); 2 µm (d); 5 µm (e, f); 1 µm (h). See also Supplementary Videos 1–4

