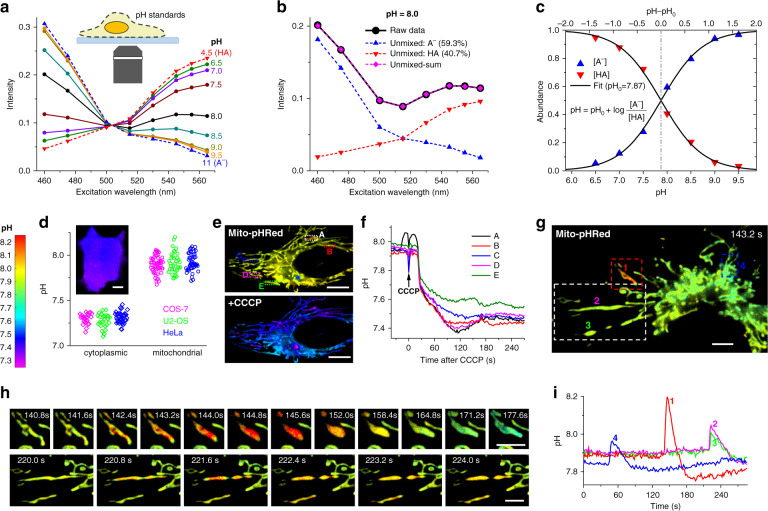
Fig. 3. Absolute pH imaging in live cells via unmixing and quantifying two fluorescent species.
a Excitation spectra measured by our spectral microscope, for pHRed in proton-permeabilized COS-7 cells in buffer standards of pH = 4.5 and 11 (dash lines; taken as pure forms of HA and A−, respectively), and of pH = 6.5–9.5 (solid lines). b Linear unmixing of the excitation spectrum at pH = 8.0 (black solid line) into HA and A− components (dash lines). c Fitting the resultant HA and A− abundances unmixed at different pH values to the Henderson–Hasselbalch equation with a single parameter pH0. d Statistics of the average pH values of the cytoplasm and mitochondrial matrix of live COS-7, U2-OS, and HeLa cells, measured with our approach using cytoplasmic pHRed and Mito-pHRed, respectively. Inset: Color-coded absolute pH map of the cytoplasm of a live COS-7 cell. e Mito-pHRed absolute pH maps (same color scale as d) of the mitochondrial matrix in a live HeLa cell, before (top) and after (bottom) 120 s treatment with 20 µM CCCP. f pH value time traces for the five regions marked in e. g Color-coded Mito-pHRed absolute pH map of the mitochondrial matrix in a live COS-7 cell, at the time point of 143.2 s. h Time sequences for the red and white boxed regions in g, for two different time windows. i pH value time traces for the four mitochondria marked in g. Experiments were performed with 8-wavelength excitation cycles at 10 fps, corresponding to 0.8 s acquisition time for each spectral image. Scale bars: 10 µm (d, e); 5 µm (g, h). See also Supplementary Videos 5–7

