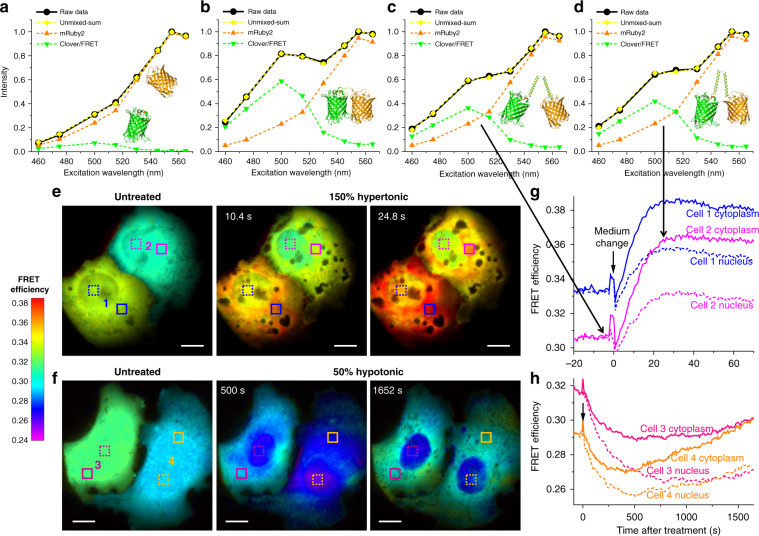
Fig. 4. FRET imaging in live cells via resolving the excitation spectrum.
a Excitation spectrum measured by our spectral microscope (black solid line) and its unmixing (dash lines) for non-interacting mRuby2 and Clover co-expressed in the cytoplasm of a live COS-7 cell. b Measured excitation spectrum and its unmixing for a directly linked Clover-mRuby2 construct expressed in a live COS-7 cell. c, d Measured excitation spectrum and its unmixing for the Clover-mRuby2 FRET crowding sensor in the cytoplasm of a live COS-7 cell, before (c) and ~25 s after (d) 150% hypertonic treatment by adding into the cell medium an equal volume of medium that was supplemented with 300 mM sorbitol. e Color-coded FRET maps for the crowding sensor, for two live COS-7 cells before (left), ~10 s after (center), and ~25 s after (right) the 150% hypertonic treatment. f Color-coded FRET maps for the crowding sensor, for two live COS-7 cells before (left), 500 s after (center), and 1650 s after (right) 50% hypotonic treatment by adding into the medium an equal volume of water. g, h FRET value time traces for the boxed regions of cytoplasm (solid lines) and nuclei (dash lines) of the four cells (e, f). Experiments were performed with 8-wavelength excitation cycles at 10 fps (0.8 s acquisition time for each spectral image). Scale bars: 10 µm (e, f). See also Supplementary Videos 8–9

