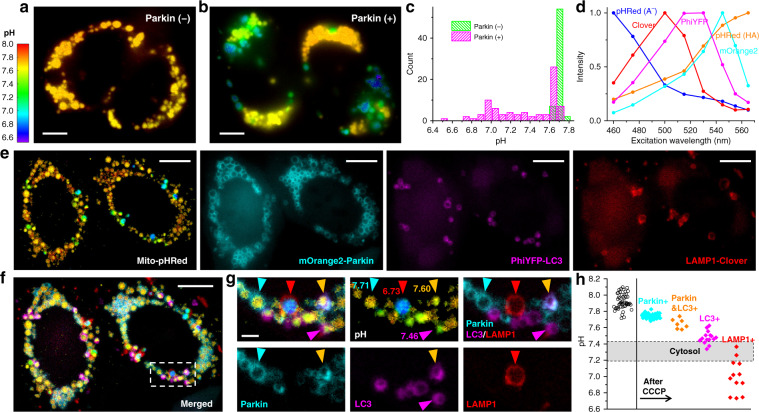
Fig. 5. Concurrent absolute pH imaging of the mitochondrial matrix with three additional FP-tagged markers in the Parkin-mediated mitophagy pathway.
a, b Color-coded Mito-pHRed absolute pH maps of live HeLa cells after the application of 20 µM CCCP for 6 h, for cells without (a) and with (b) the co-expression of fluorescently untagged Parkin. c Distribution of the measured pH values in each mitochondrion for a, b. d Excitation spectra on our setup for the five fluorescent species unmixed to enable absolute pH imaging with three additional FP markers. e Unmixed images of color-coded Mito-pHRed absolute pH map, mOrange2-Parkin, PhiYFP-LC3, and LAMP1-Clover for two Parkin-expressing live HeLa cells after the application of 20 µM CCCP for 4 h. f Overlay of the images in e. g Zoom-in of the white box in f, as well as its separation into different channels. Cyan, magenta, and red arrowheads point to individual mitochondria only marked by Parkin, LC3, and LAMP1, with respective matrix pH values quantified from the enclosed Mito-pHRed signals indicated. Orange arrowhead points to a mitochondrion marked by both Parkin and LC3. h Distribution of the Mito-pHRed-quantified matrix pH of individual mitochondria in the sample labeled by the different markers (color diamonds), compared to that in untreated HeLa cells (black circles). Shaded band: typical range of cytoplasmic pH. Experiments were performed with 8-wavelength excitation at 10 fps (0.8 s acquisition time for each spectral image). Scale bars: 5 µm (a, b); 10 µm (e, f); 2 µm (g)

