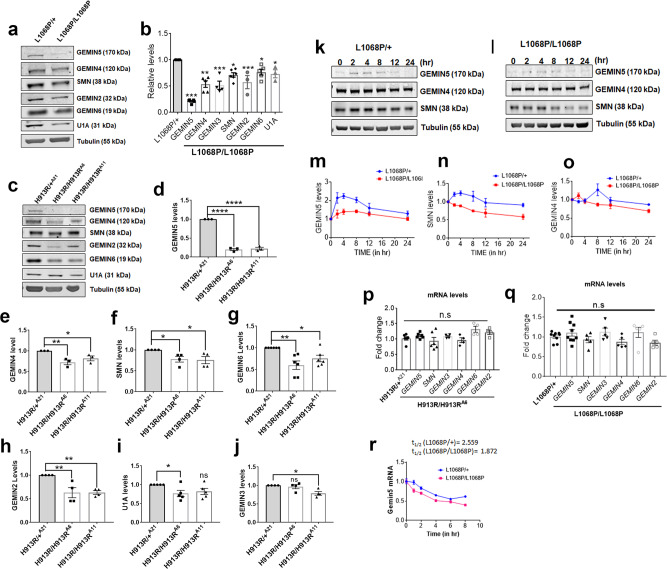
Fig. 3. GEMIN5 variants reduce the levels of GEMIN5 and SMN assembly proteins.
a Western blot (WB) analysis of total protein extract from IPSC-derived neuronal cells carrying mono-allelic and bi-allelic L1068P GEMIN5 variants depicting the levels of GEMIN5, GEMIN4, GEMIN6, and GEMIN2, SMN, and U1A, respectively. b Quantitative bar plots showing the reduced levels of GEMIN5 and SMN assembly proteins in L1068P homozygous neurons compared to heterozygous controls (two-tailed unpaired t test, n = 4). c Representative WB depicting the expression levels of GEMIN5 and SMN complex proteins in heterozygous and homozygous H913R neurons d–j, Quantitative comparison of expression levels of GEMIN5 (d), GEMIN4 (e), SMN (f), GEMIN6 (g), GEMIN2 (h), U1A (i), and GEMIN3 (j) between H913R−/− and H913R+/− neuronal cells as in (d) (one-way ANOVA-Bonferroni test, n = 4). k, l Representative WB showing the protein levels of GEMIN5, GEMIN4, and SMN in L1068P heterozygous (k) and homozygous (l) neurons after 0, 2, 4, 8, 12, and 24 h of cycloheximide (CHX) treatment. Tubulin was used as normalization control. m–o Quantitative analysis of the rate of degradation of GEMIN5 (m), SMN (n), and GEMIN4 (o) after CHX treatment showed the increased rate of depletion of GEMIN5 and SMN in homozygous L1068P neurons as compared to heterozygous controls (nonlinear regression-one phase decay, n = 4). p, q Expression analysis of GEMIN5, SMN, and other GEM-proteins by qPCR in L1068P (p) and H913R (q) neurons. The transcript levels of GEMIN5, GEMIN4, GEMIN3, GEMIN6, GEMIN2, and SMN showed no significant changes among heterozygous and homozygous GEMIN5, L1068P, and H193R variants (two tailed Mann–Whitney U test, n = 6). r Quantitative PCR showing the relative stability of GEMIN5 mRNA between hetero and homozygous L1068P neurons by using total RNA isolated at 0, 1, 2, 4, 6, and 8 h after actinomycin D treatment (nonlinear regression-one phase decay, n = 4). The data represent mean ± SEM. P values (****<0.0001, ***<0.001, **<0.01). Source data are provided as a Source Data file.

