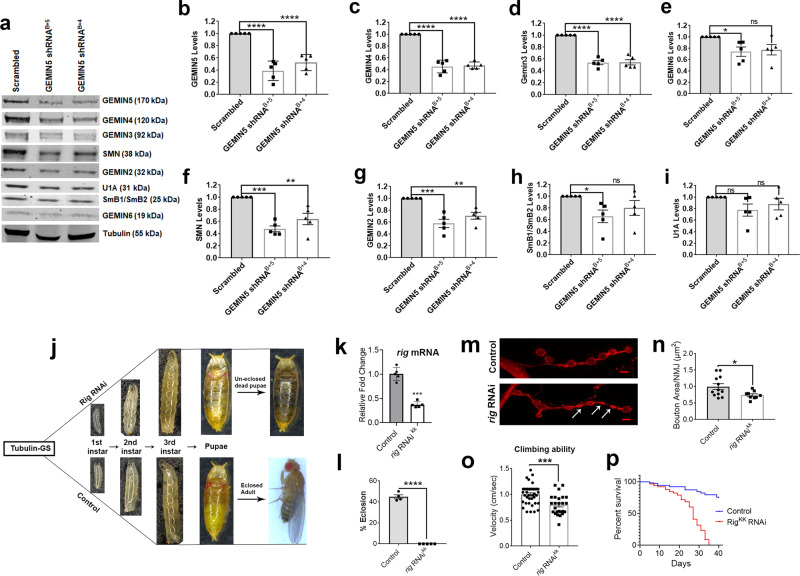
Fig. 4. Loss of GEMIN5 leads to decrease levels of snRNP complex proteins and, developmental defects and motor dysfunction in Drosophila.
a Representative WB showing the effect of shRNA-mediated knockdown of GEMIN5 on the levels of GEMIN4, GEMIN3, GEMIN2, GEMIN6, SMN, SmB1/B2, and U1A as compared to scrambled control. GEMIN5 shRNA B was used in combination with GEMIN5 shRNA 5 and 4 to obtain the maximum knockdown efficiency. α tubulin was used as internal control (n = 5). b–I Quantitative analysis showed a significant decrease in the levels of GEMIN4 (c), GEMIN3 (d), GEMIN6 (e), SMN (f), GEMIN2 (g), and SmB1/B2 (h) upon ~65% knockdown of GEMIN5 (b). No significant change was found in U1A protein levels (i) (one-way ANOVA-Bonferroni test, n = 5). j Flow diagram comparing different developmental stages of flies between rigor mortis RNAi and W1118 control flies. RNAi-mediated knockdown of rigor mortis, as determined by qPCR in (k), resulted in pupal lethality (j) and eclosion defects (l) as measured by percentage eclosed adult homozygous flies (two tailed unpaired t test, n = 5). The RNAi transgene under inducible tubulin-UAS gal4 system was expressed by growing the larvae on 1 mM RU486 drug food. m Representative IF images of neuromuscular junction (NMJ) marked with HRP (pre-synaptic marker) in the larval segment expressing rig mortis RNAi compared to control (scale bar = 10 µm). n Quantitative comparison of the bouton size measured as area per NMJ between the rig mortis RNAi expressing larvae and control (two-tailed Mann–Whitney U test, n = 12). o Bar graph representing rapid iterative negative geotaxis (RING) assay, calculated as climbing speed of a fly per second, showed significant defects in the climbing velocities of flies with RNAi-mediated GEMIN5 KD as compared to controls. The effect was apparent when the transgene was expressed for 20 days on 20 mM RU486 drug food under the control of tubulin-GS driver (two-tailed Mann–Whitney U test, n = 25–39). p Kaplan–Meier survival plot showing the effect of the loss of endogenous rig mortis on the life span of flies. The flies were grown on 20 mM RU486 drug food to express the rig mortis RNAi transgene and monitored every day for the span of 45 days (log-rank (Mantel–Cox) test, n = 80). The data represent mean ± SEM. P values (****<0.0001, ***<0.001, **<0.01). Source data are provided as a Source Data file.

