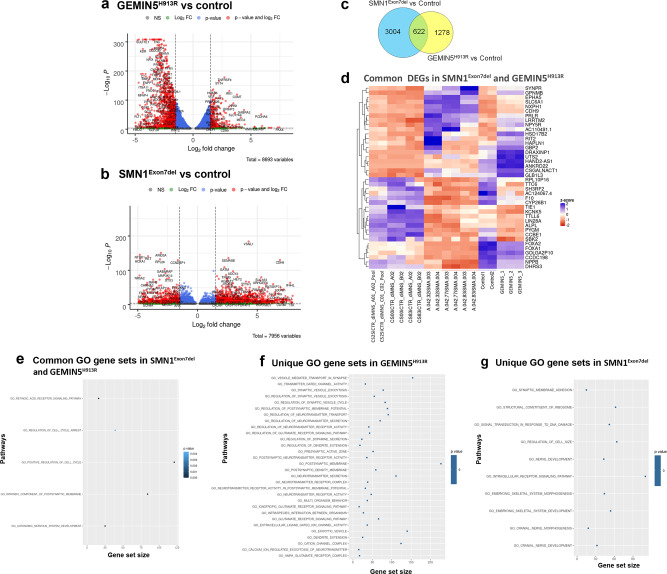
Fig. 6. RNA-seq analysis of GEMIN5 patient iPSC neurons reveals a distinct and unique transcriptomic profile compared to SMA patient iPSC neurons.
a, b Volcano plot showing up and down-regulated genes in SMNExon7del vs. control (a) and, GEMIN5H913R vs. control (b) selected by p-value < 0.01 & log2(fold change) ≥ 1.5. The x-axes show log2 values of the fold changes in gene expression between the samples and y-axis shows −log10-transformed p-values. Significant genes were selected after Benjamini–Hochberg (BH) correction. c Venn diagram showing the number of genes that are shared between SMA and GEMIN5 and the genes which are exclusively to both. Only the DEGs with ≥1.5 log-fold DEGs were used for the comparison. d Heat map depicting the expression pattern of top 20 up and downregulated DEGs common to both SMNExon7del and GEMIN5H913R. Significant genes were selected by Wald test in DESeq2 and multiple test correction by BH. e–g Functional characterization of the genes with the MSigDB ‘c5 Gene Ontology (GO), biological process ontology (BP) v6.0’ gene sets in SMNExon7del and GEMIN5H913R (e), unique to GEMIN5H913R (f) and SMNExon7del (g). The size of the dot corresponds to the number of genes per term, and the color of the dot indicates the enrichment significance. Source data are provided as a Source Data file.

