
Figure 2.
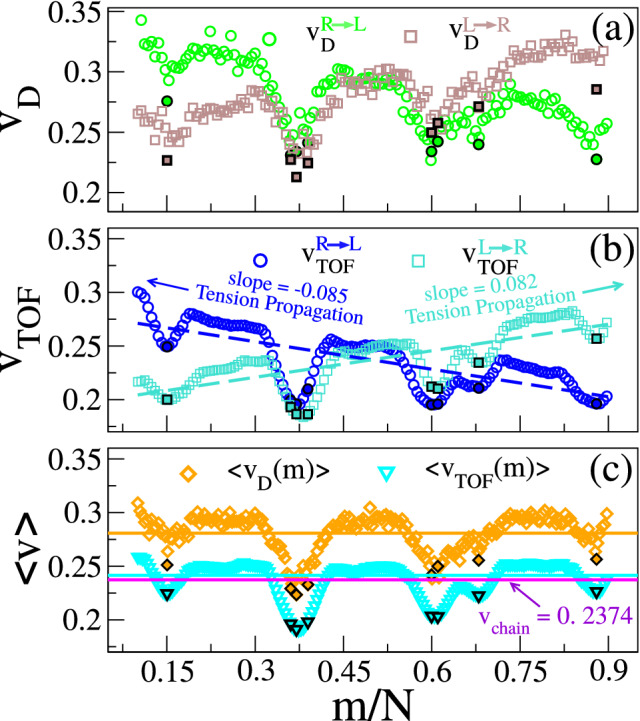
(a) Dwell velocities and (b) TOF velocities of the monomers during (blue circle) and (turquoise square) translocation. Eight tag velocities are marked by the filled symbols. The dashed lines (turquoise and blue) indicate the directions of the tension propagation for and respectively. (c) Directional averaged dwell velocity and TOF velocities are represented with orange diamond and turquoise inverted triangle. The solid orange horizontal line represents average dwell velocity and the cyan line represents the average tof velocity of all monomers respectively. The average velocity of the entire chain is represented by the violet line.