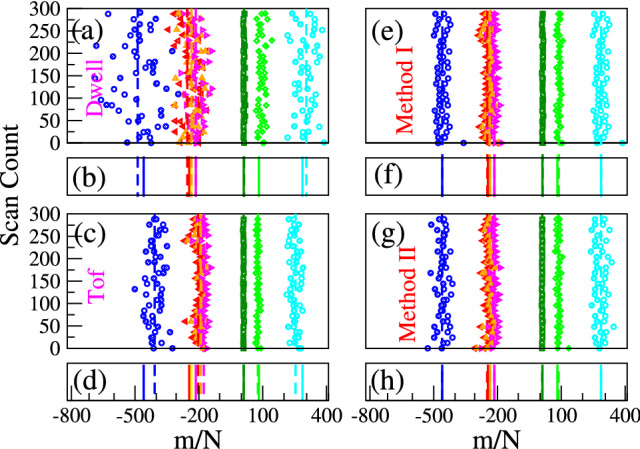
Figure 3.

Barcodes generated using (a) Eq. (7) and (c) Eq. (6c). Colored symbols/lines refer to the barcodes , , , , , , , and calculated w.r.t . The open/filled symbols correspond to translocation. For better visualization, every 6th data point is shown. The solid/dashed colored lines in (b) and (d) are the exact and the calculated barcodes averaged over 300 scans. Figures (e,f) Barcodes generated using different methods using tof velocity information.
