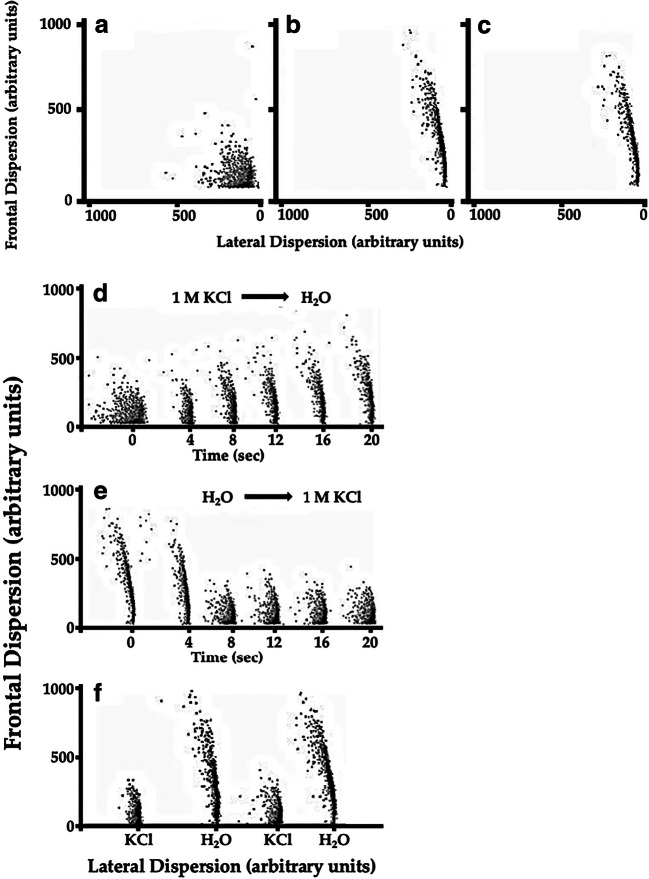
Fig. 3.
Volume changes in response to the hypertonicity of different external media. Typical bar plots were obtained using a fluorescence-activated cell sorter apparatus. Bar plots show frontal dispersion (reflecting cell size) and lateral dispersion (reflecting cell surface complexity, or roughness). Cells were maintained in 1 M KCl (a), distilled water (b), or YPD (c). Panel d illustrates the rapid modifications of cell size and shape when replacing the extracellular media (1 M KCl) with distilled water. Panel e illustrates the opposite experiment; cells maintained in distilled water were rapidly changed to 1 M KCl. (F) The same yeast sample was exposed to 1 M KCl then placed in distilled water and back to KCl and finally in distilled water. Histograms show the reproducibility of the response to these extreme osmolarities

