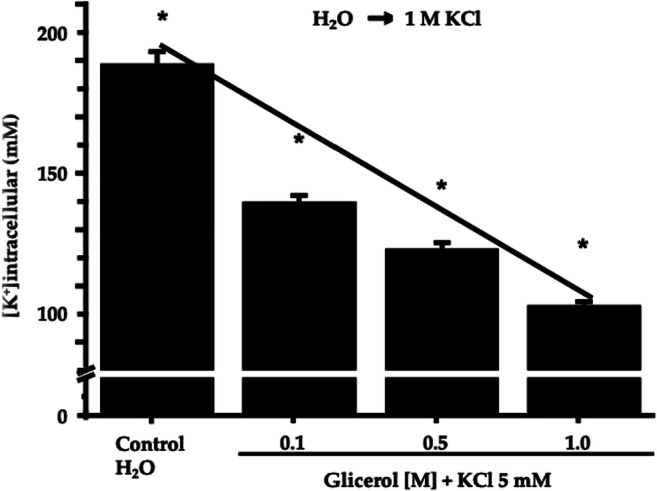
Fig. 4.

Determination of potassium content after osmotic stress with glycerol. The bar plot shows the reduction in the intracellular potassium concentration (in mM) obtained with increments in the extracellular osmolarity. Intracellular potassium was measured using a flame photometer, as described under Materials and Methods. In all cases, combined data represent the mean ± standard deviation from independent observations (N = 9). All data points were statistically different by a t-student test, as marked by * (p < 0.005)
