
Fig. 4.
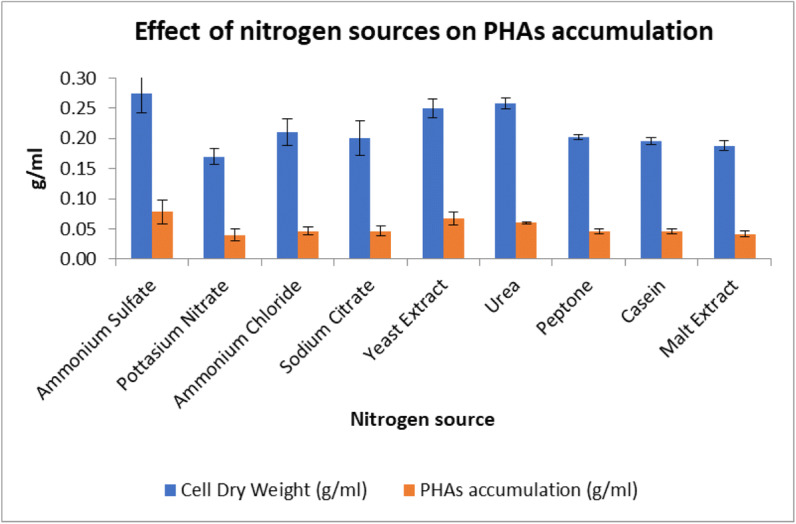
Effect of different nitrogen sources on PHA accumulation and dry cell weight by isolate M12. Data represent mean ± SD (n=3); P ˂ 0.05
Official websites use .gov
A
.gov website belongs to an official
government organization in the United States.
Secure .gov websites use HTTPS
A lock (
) or https:// means you've safely
connected to the .gov website. Share sensitive
information only on official, secure websites.
Effect of different nitrogen sources on PHA accumulation and dry cell weight by isolate M12. Data represent mean ± SD (n=3); P ˂ 0.05