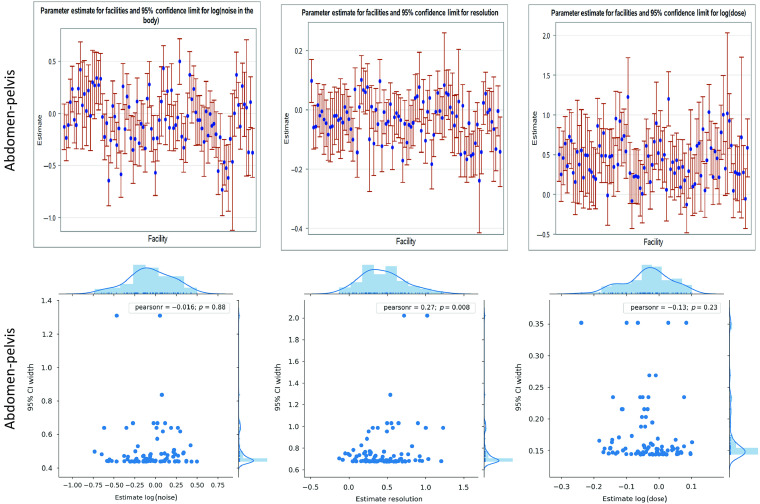
Fig. 3.
(a) The best linear unbiased parameter estimates of the facility ID term for random effects model A reflect both high levels of interfacility variability and intrafacility variability (shown in the whisker plots). (b) However, there is little correlation between noise/resolution/dose values at a facility and variability at that facility. The blue points show the most likely value of noise, resolution, and dose at each facility for abdomen-pelvis exams. Thus differences in the location of these points reflect interfacility variability in image quality and dose. The error bars denote the 95% confidence interval of the estimate and reflect intrafacility variability at each facility in the same quantities—i.e., shorter bars at a facility denote more consistency and less variability within the scan population at that facility. (b) shows these estimate values for each facility against the uncertainty in the estimates with associated correlation coefficients between the two values. The low correlation values show that there is little relation between the most likely image quality/dose level at a facility and the variability in quality/dose across patients at that facility. That is, consistency and magnitude of noise/resolution/dose level are not well-correlated.

