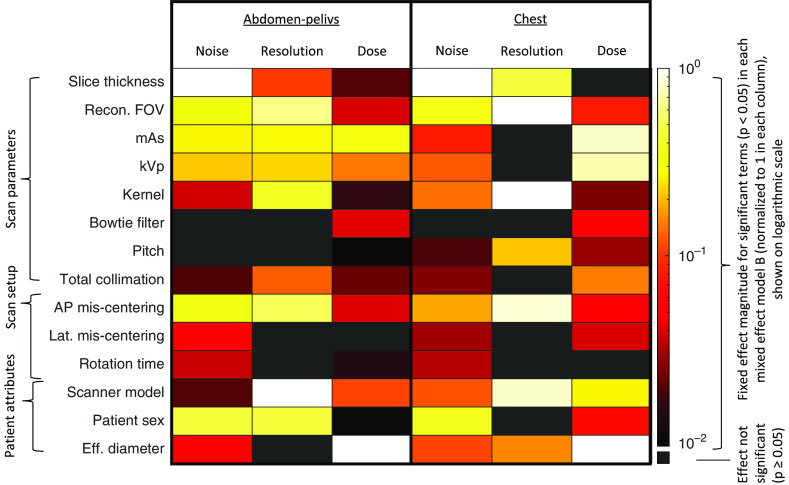
Fig. 4.
A summary of the fit results of a mixed effects model B for abdomen-pelvis and chest exams. This figure shows which fixed effects were most explanatory for resolution, noise, and dose (with ). Colors denote the magnitude of an effect (using log scale). Black cells denote the effects that were not significant. For discrete features with sublevels, sublevel with largest magnitude is shown.

