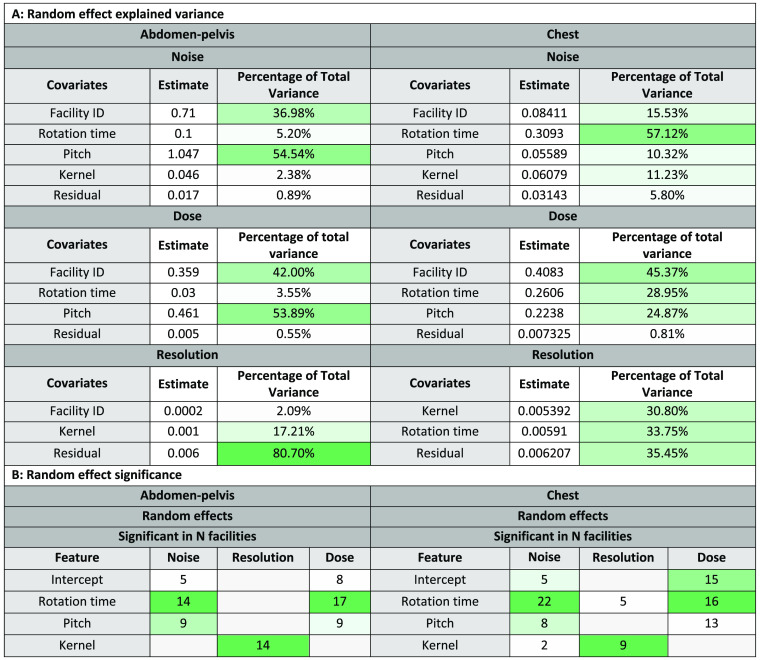
Fig. 5.
Random effects from mixed effects model B indicating the contribution of leading protocol factors to the total variability in noise/resolution/dose between scans. Random effects with greater contribution are denoted by a darker green. The residual terms account for the fixed effects as well as the estimation error of the models. Table A details how much variance is explained by each random effect. Table B shows the number of facilities with a significant -value for the indicated protocol factor. A darker green denotes which effects were more commonly significant at facilities.

