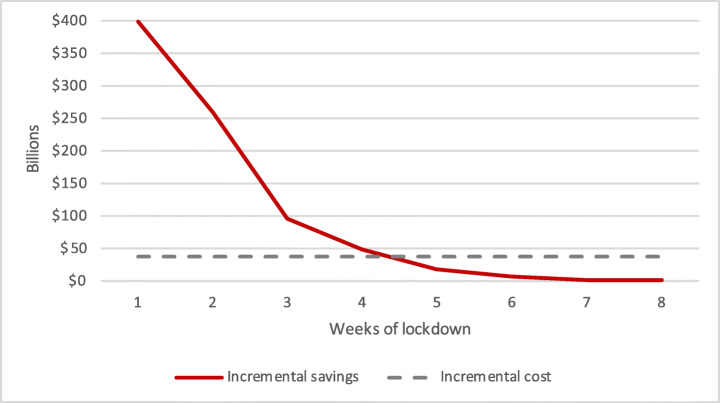
Fig. 4.
Incremental costs and savings of each additional week of a lockdown. SOURCES CDC COVID Data Tracker, Census Bureau, author’s calculations. Specific sources for SIR model inputs and incremental savings and cost estimates of a lockdown are provided in Table 5 of the Appendix. Assuming that a lockdown is imposed a week from now, this figure plots projected incremental costs and savings of extending lockdown by another week, to the number of weeks specified on the horizontal axis

