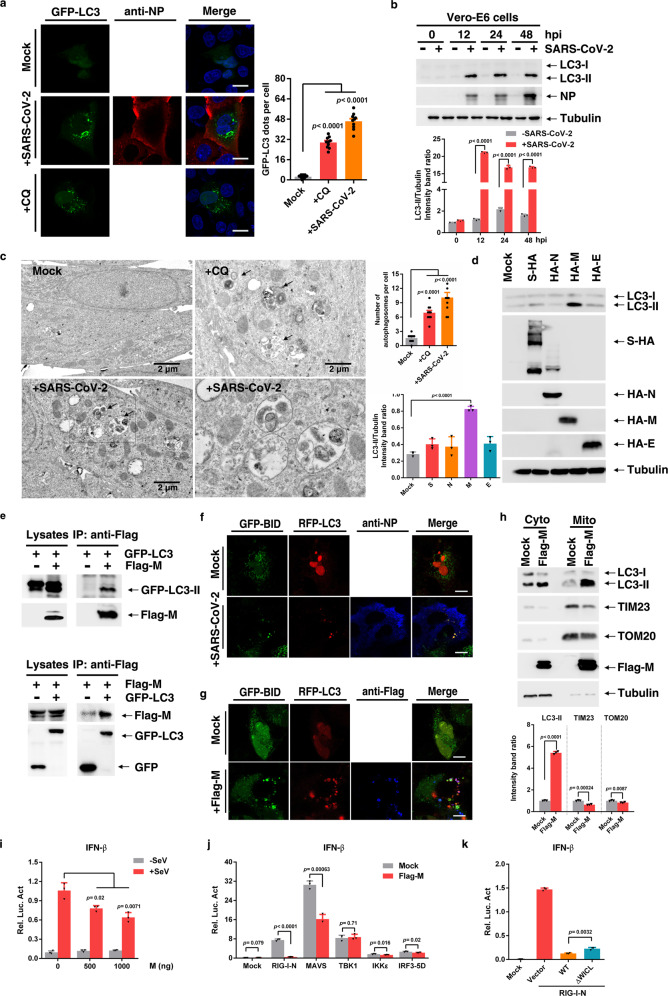
Fig. 1.
SARS-CoV-2 promote autophagy to suppress type I interferon response. a GFP-LC3 dot formation in Vero-E6 cells transiently transfected with GFP-LC3 and either left uninfected (Mock) or infected with SARS-CoV-2 (MOI of 0.05) for 48 h or treated with CQ for 4 h. Scale bar, 10 µm. b Vero-E6 were uninfected (−) or infected (+) with SARS-CoV-2. Lysates were evaluated by western blotting (WB). c EM analysis of Vero-E6 cells that were stimulated with CQ for 4 h, or infected with SARS-CoV-2 (MOI of 0.05) for 24 h. Scale bar, 2 µm. d Huh7.0 cells were transfected with vector or S-HA, HA-M, HA-N, or HA-E plasmid. Lysates were analysed by immunoblotting. e Interaction between Flag-M and GFP-LC3 in HEK293T cells. f Huh7.0 cells were transfected with the indicated plasmids and infected with SARS-CoV-2 and analysed for the co-localization of BID-GFP and RFP-LC3. g Huh7.0 cells were transfected with the indicated plasmids and analysed for the co-localization of BID-GFP and RFP-LC3. h Huh7.0 cells were transfected with Flag-M plasmid, and mitochondrial fractions were isolated via ultracentrifugation. Cytoplasm (Cyto) and mitochondria (Mito) were analysed by immunoblotting. i HEK293T cells were transfected with the indicated plasmids and infected with Sendai virus for 8 h before the reporter assay was conducted. j HEK293T cells were transfected with the indicated plasmids, and a reporter assay was conducted after transfection. k HEK293T cells were transfected with the indicated plasmids, and a reporter assay was conducted after transfection. Three independent experiments with three technical repetitions were performed. Data are expressed as mean ± SEM (error bars). Statistical analyses used Student’s t test. P < 0.05 was considered statistically significant

