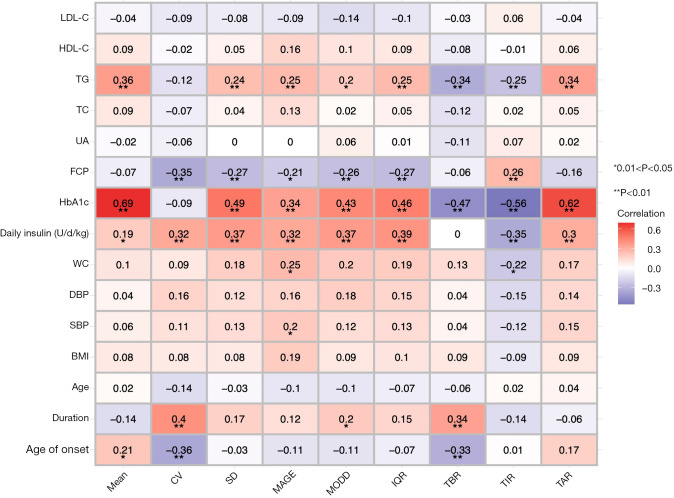
Figure 1.
Spearman correlation heat map between FGM-derived metrics and clinical variables. The values of the color bar represent the Spearman’s r. The red color means a positive correlation whereas the purple color means negative correlation. Darker color indicates increased correlation. *P<0.05; **P<0.01. BMI, body mass index; SBP, systolic blood pressure; DBP, diastolic blood pressure; WC, waist circumference; HbA1c, hemoglobin A1c; FCP, fasting C-peptide; UA, uric acid; TC, total cholesterol; TG, triglyceride; HDL-C, high-density lipoprotein cholesterol; LDL-C, low-density lipoprotein cholesterol; Mean, mean of glucose; CV, coefficient of variation for glucose; SD, standard deviation of glucose; MAGE, mean amplitude of glucose excursion; MODD, mean of daily differences; IQR, interquartile range of glucose; TBR, time below range (glucose <3.9 mmol/L); TIR, time in range (glucose 3.9–10.0 mmol/L); TAR, time above range (glucose >10.0 mmol/L).

