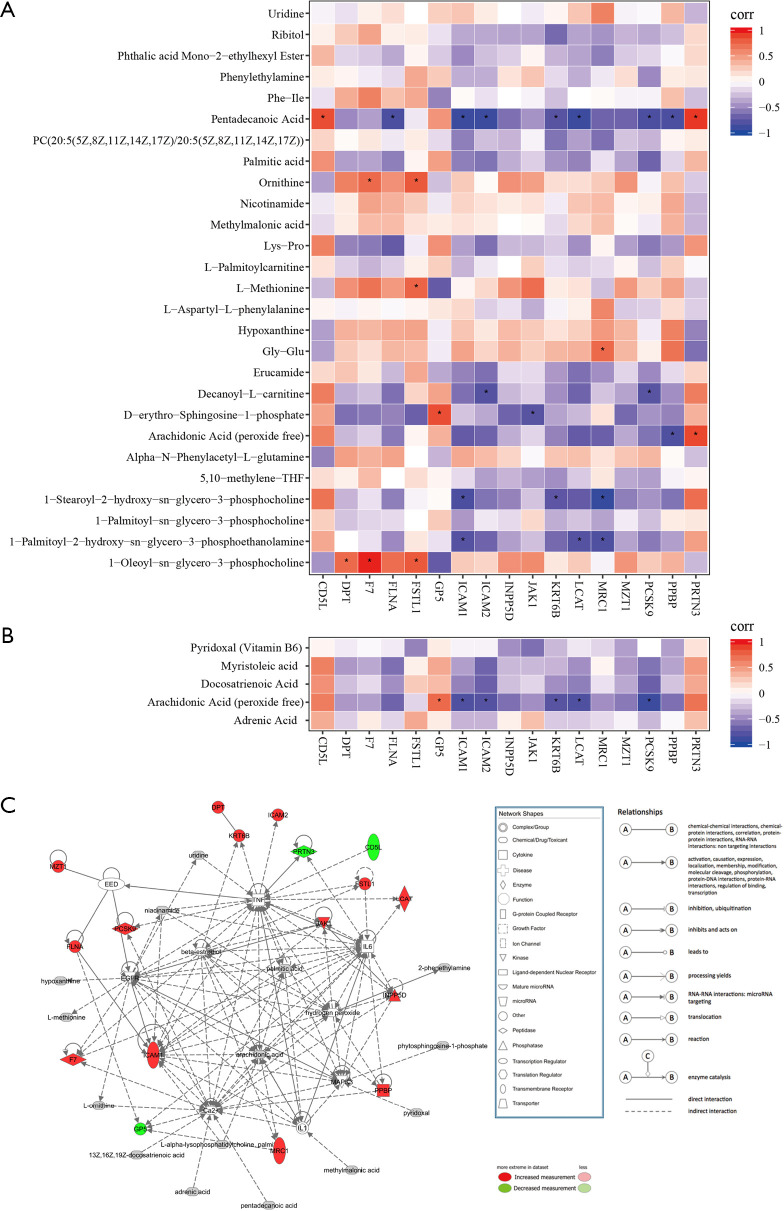
Figure 1.
Correlation analysis between differential proteins and metabolites and IPA analysis. (A) Spearman correlation analysis in the positive mode and (B) in the negative mode. *, P<0.05. Red (corr =1), Blue (corr =−1), White (corr =0). The horizontal coordinate is differential proteins, and the vertical coordinate is differential metabolites. (C) IPA pathway enrichment analysis. IPA, ingenuity pathway analysis.

