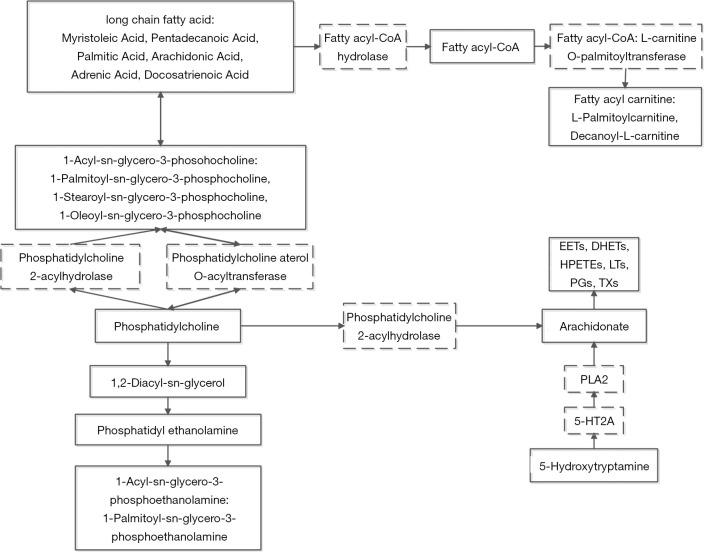
Figure 2.
The diagram of regulatory network. Linking metabolites and proteins in serum with a network map to visualize the interactions in the full data set. The dotted box: the enzyme that catalyzes the reaction; The solid box: metabolites in the reaction pathway; Red: elevated metabolites in PD-CI. PD-CI, Parkinson’s disease with cognitive impairment.

