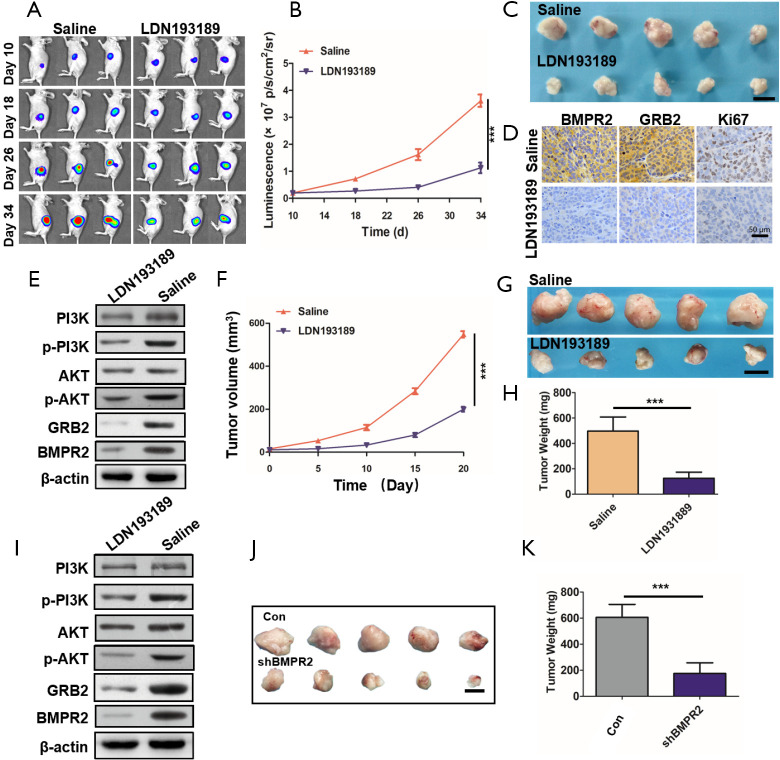
Figure 6.
LDN193189 inhibited PDAC growth in vivo. (A) Representative bioluminescent images of orthotopic pancreatic cancer models during the treatment. (B) Bioluminescent densities during the treatment. (C) Tumor images at the end of the treatment, n=5. (D) Representative IHC images showing the expression of BMPR2, GRB2 and Ki67 of tumors. (E) Western blot analysis of the orthotopic tumors. (F) Tumor growth curves of PDX during the treatment. (G) Image of tumors excised from PDX mouse models at the end of the treatment, n=5. (H) Tumor weight analysis of PDX models. (I) Western blot analysis of the PDX tumors. (J,K) Tumor growth after knockdown of BMPR2 by shRNA (n=5). Scale bar represents 1 cm. The data are shown as the mean ± SD. ***, P<0.001. IHC, immunohistochemistry; BMPR2, bone morphogenic protein receptor 2; PDX, patient-derived xenograft; PDAC, pancreatic ductal adenocarcinoma.

