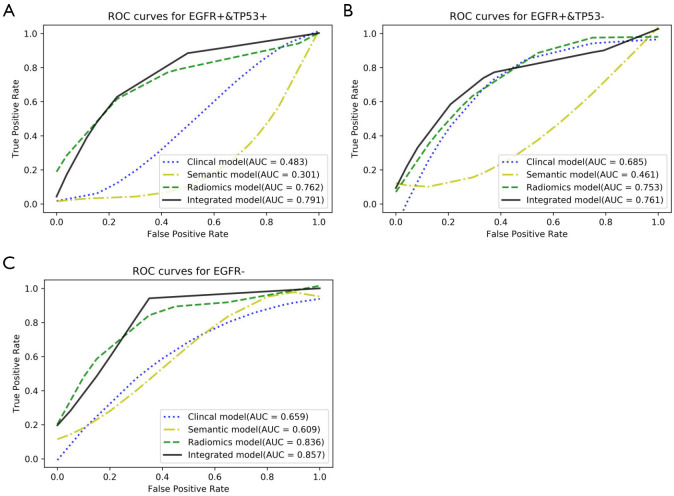
Figure 3.
The performance of the three-type classifier. (A) ROC curves of the four different models for distinguishing the co-mutation status of EGFR+ & TP53+. (B) ROC curves of the four different models for distinguishing the co-mutation status of EGFR+ & TP53−. (C) ROC curves of the four different models for distinguishing the co-mutation status of EGFR−. Area under the ROC curves (AUCs) were used to evaluate the distinguishing efficacy of the four different models. The integrated model displayed the best performance for all the three subtypes of co-mutation status. ROC, receiver-operating characteristic; EGFR, epidermal growth factor receptor.

