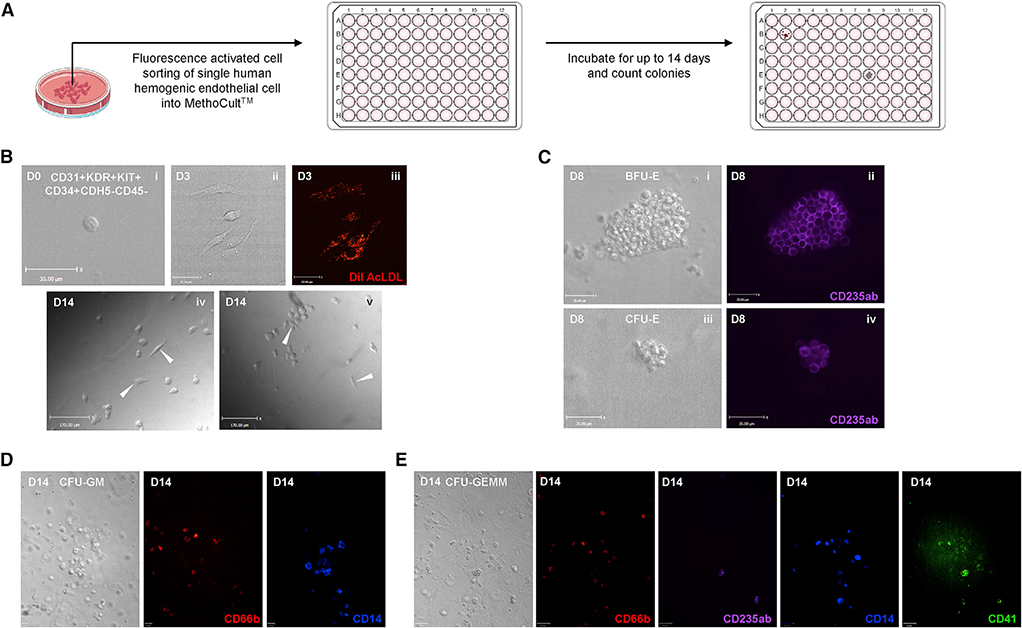
Figure 3. Characterization of the Phenotype of Human Hemogenic Endothelial Cells on a Single-Cell Level.
(A) Schematic representation of single-cell blood-forming assay.
(B) Representative photographs showing single human hemogenic endothelial cell on D0 (i), hemogenic endothelial cell colony on D3 (ii), DiI AcLDL uptake of hemogenic endothelial cells on D3 (iii), and adherent hemogenic endothelial cells among blood cells on D14 (iv and v). Scale bars, 35 μm for (i), (ii), and (iii). Scale bars, 170 μm for (iv) and (v).
(C) Representative photographs showing BFU-E (i and ii) and CFU-E (iii and iv) on D8, marked by CD235ab. Scale bars, 35 μm.
(D) Representative photographs showing CFU-GM on D14, marked by CD66b and CD14. Scale bars, 35 μm.
(E) Representative photographs showing CFU-GEMM on D14, marked by CD66b, CD235ab, CD14, and CD41. Scale bars, 70 μm.

