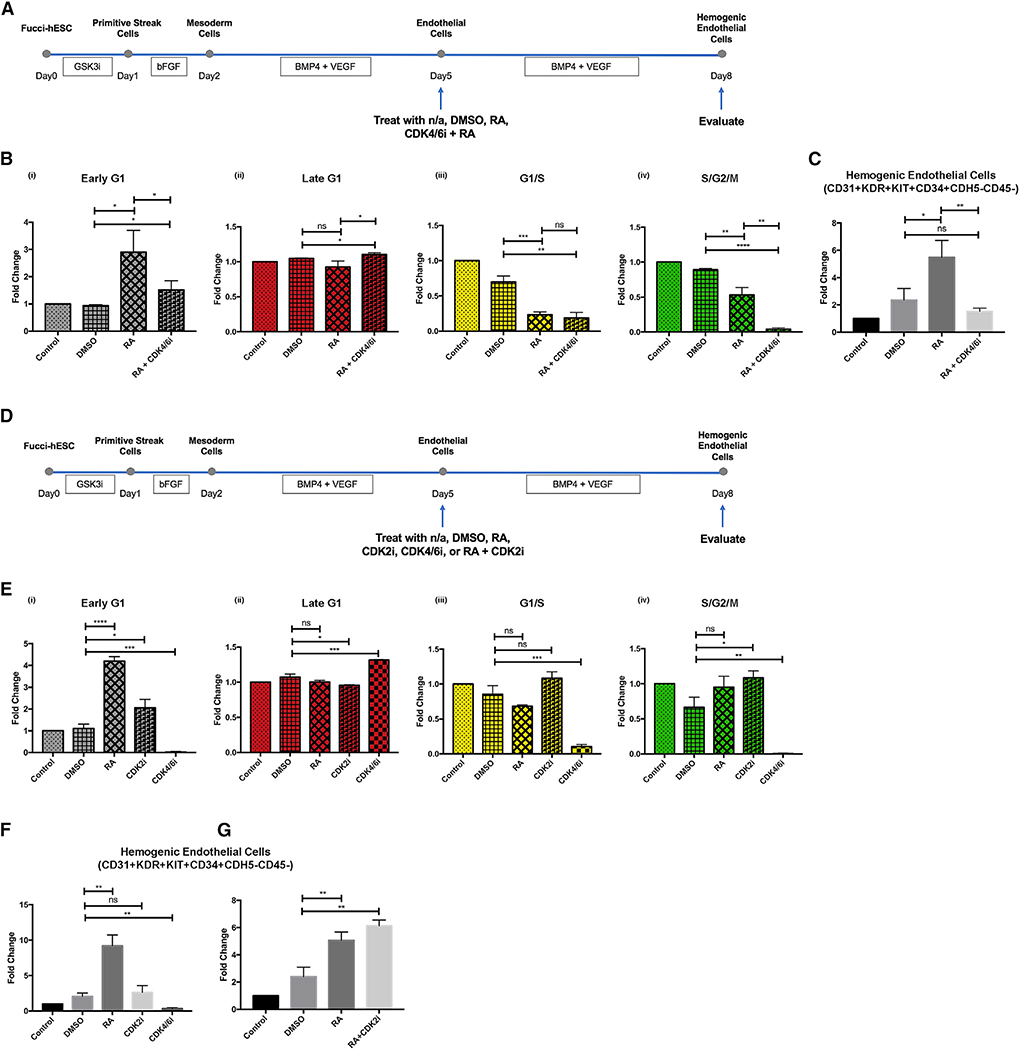
Figure 5. Early G1 Cell Cycle State of Endothelial Cells Is Necessary but Not Sufficient to Enable Hemogenic Specification.
(A) Schematic representation of experimental design.
(B) When cells were treated with both RA and CDK4/6i, CDK4/6i overrides effect of RA on cell cycle state and enriches endothelial cells in late G1 phase. Cell cycle distribution was measured by expression of the FUCCI reporter construct using flow cytometry; n = 3 for all groups. (i) Student’s t test: p = 0.0130 (DMSO versus RA), p = 0.0423 (DMSO versus RA+CDK4/6i), p = 0.0497 (RA versus RA+CDK4/6i). (ii) Student’s t test: p = 0.0205 (DMSO versus RA+CDK4/6i), p = 0.0253 (RA versus RA+CDK4/6i). (iii) Student’s t test: p = 0.0010 (DMSO versus RA), p = 0.0016 (DMSO versus RA+CDK4/6i). (iv) Student’s t test: p = 0.0046 (DMSO versus RA), p < 0.0001 (DMSO versus RA+CDK4/6i), p = 0.0015 (RA versus RA+CDK4/6i).
(C) In the absence of early G1 cell cycle arrest in endothelial cells, RA+CDK4/6i could not induce hemogenic endothelial cell specification; n = 3 for all groups. Student’s t test: p = 0.0233 (DMSO versus RA), p = 0.0059 (RA versus RA+CDK4/6i).
(D) Schematic representation of experimental design.
(E) Similar to RA, CDK2i induces early G1 cell cycle arrest in endothelial cells. Cell cycle distribution was measured by expression of the FUCCI reporter constructusing flow cytometry; n = 3 for all groups. (i) Student’s t test: p < 0.0001 (DMSO versus RA), p = 0.0196 (DMSO versus CDK2i), p = 0.0007 (DMSO versus CDK4/6i). (ii) Student’s t test: p = 0.0115 (DMSO versus CDK2i), p = 0.0007 (DMSO versus CDK4/6i). (iii) Student’s t test: p = 0.0005 (DMSO versus CDK4/6i). (iv) Student’s t test: p = 0.0148 (DMSO versus CDK2i), p = 0.0014 (DMSO versus CDK4/6i).
(F) Unlike RA, CDK2i could not induce hemogenic endothelial cell specification; n = 3 for all groups. Student’s t test: p = 0.0016 (DMSO versus RA), p = 0.0051 (DMSO versus CDK4/6i).
(G) CDK2i did not artificially suppress cell growth or cell differentiation in culture. Student’s t test: p = 0.0077 (DMSO versus RA), p = 0.0015 (DMSO versusRA+CDK2i).
Data are represented as means ± SDs

