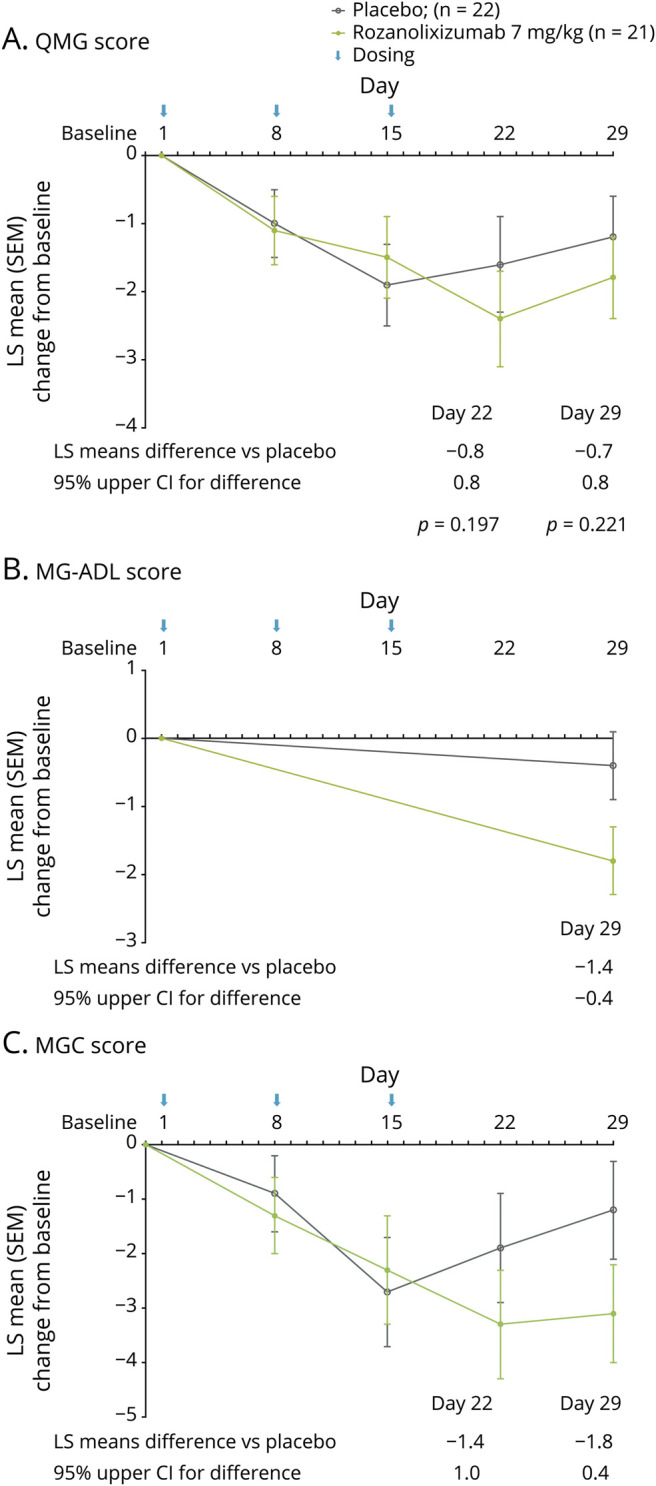
Figure 2. Change in Measures of Clinical Effect from Baseline to Day 29 (Period 1).

Change from baseline to day 29 in (A) Quantitative Myasthenia Gravis (QMG) score, (B) Myasthenia Gravis–Activities of Daily Living (MG-ADL) score, and (C) Myasthenia Gravis–Composite (MGC) score. Data are least squares (LS) mean change from baseline of the full analysis set; error bars show SEM. CI = confidence interval; SEM = standard error of the mean.
