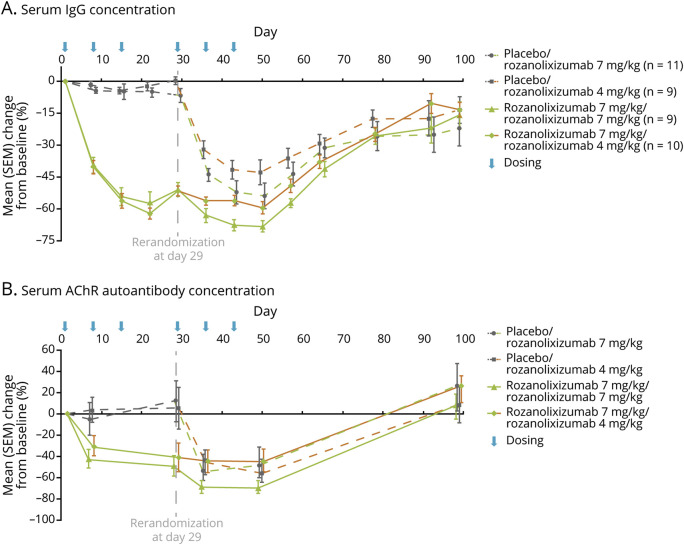
Figure 5. Mean Percent Change From Baseline in Serum Immunoglobulin G (IgG) (Pharmacodynamic per Protocol Analysis Set) and Anti–acetylcholine Receptor (AChR) (Full Analysis Set [FAS]) Following Rozanolixizumab Treatment.
(A) Serum IgG concentration. (B) Serum AChR autoantibody concentration. Data are from FAS group members who were AChR-positive at baseline; up to 40 patients in period 1 and up to 39 patients in period 2 are included in the analysis. For both graphs, data are presented as mean percent change from baseline, error bars show standard error of the mean (SEM).

