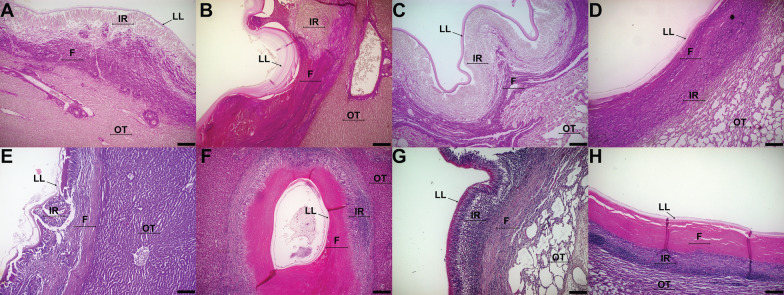
Figure 3.
Fibrosis patterns between cattle and sheep non-fertile CE cysts. A, E Cattle non-fertile liver CE cyst (Pattern I), B, F Sheep non-fertile liver CE cyst (Pattern III), C, G Cattle non-fertile lung CE cyst (Pattern I), D, H Sheep non-fertile lung CE cyst (Pattern III). LL = Laminated layer, IR = inflammatory reaction, OT = organ tissue, F = fibrosis. A, B, C, D = Van Gieson stain. E, F, G, H = Haematoxylin–eosin stain. Size bar: 200 µm. CE = Cystic echinococcosis.

