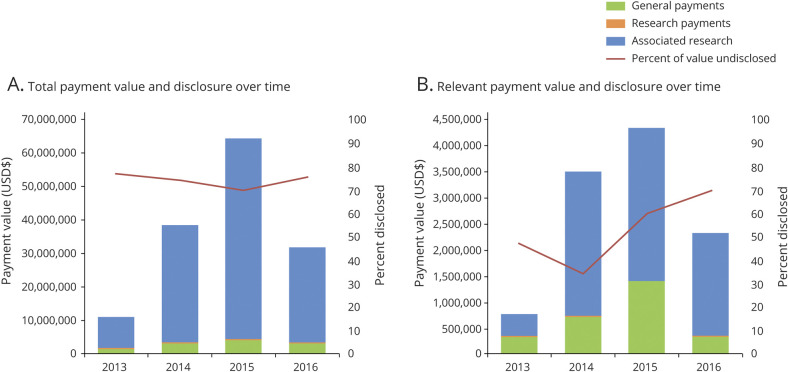
Figure 2. Value and Nature of Industry-Related Payment to Neurologist Authors and Rates of Payment Underdisclosure (2013–2016).
Stacked bars for total associated research payments (blue), research payments (orange), and general payments (green) depict the total value of payments from Industry to select authors of neurology journals. The red line depicts the percentage of these payments that were undisclosed in the manuscript by authors. (A) All payments reported in the Open Payments Database to included authors (n = 200). (B) Payments reported in the Open Payments Database to authors from companies that manufacture drugs or devices directly relevant to the article (n = 56).

