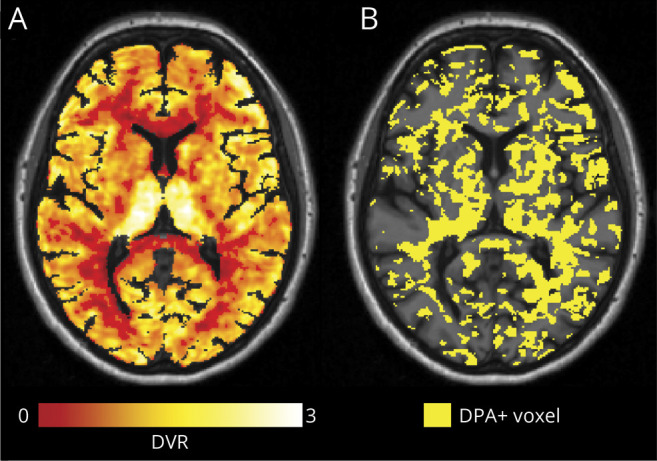
Figure 2. Illustrative Example of [18F]-DPA714 DVR Maps and the Corresponding Individual Map of DPA+ Voxels.

(A) [18F ]-DPA714 distribution volume ratio (DVR) map of a representative patient with multiple sclerosis (MS) (45-year-old female patient with secondary progressive MS, disease duration 22 years, Expanded Disability Status Scale [EDSS] score at baseline 6, EDSS step change in the 2 years preceding baseline 1.5). Map was obtained using Logan graphical analysis with reference region extracted with a supervised clustering approach. (B) Corresponding individual map of voxels characterized by a significant activation of innate immune cells (DPA+) (yellow) obtained by thresholding the DVR map of panel A (see text for details about the thresholding technique used).
