
Figure 5. Periventricular Innate Immune Cells Activation Associates With Clinical Trajectories of Disability Worsening.
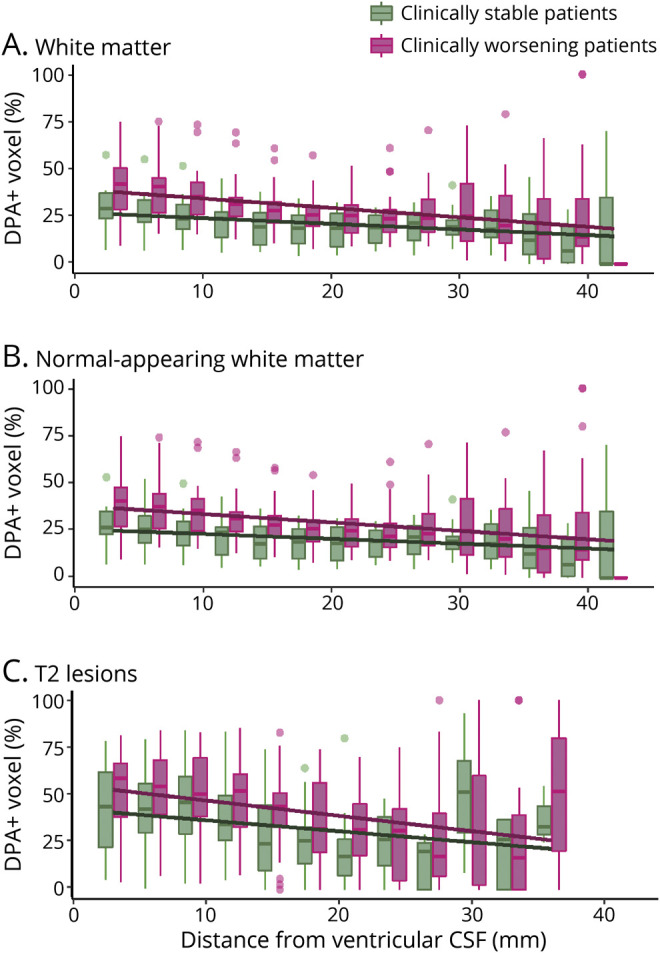
Boxplots represent the percentage of voxels characterized by a significant activation of innate immune cells (DPA+) in (A) the total white matter, (B) the normal-appearing white matter, and (C) T2 lesions of clinically stable patients (green) and clinically worsening patients (pink) calculated in 3-mm-thick concentric rings radiating from the ventricular CSF toward the cortex. Solid lines represent the mixed-effect model fits obtained at the population level for both groups.