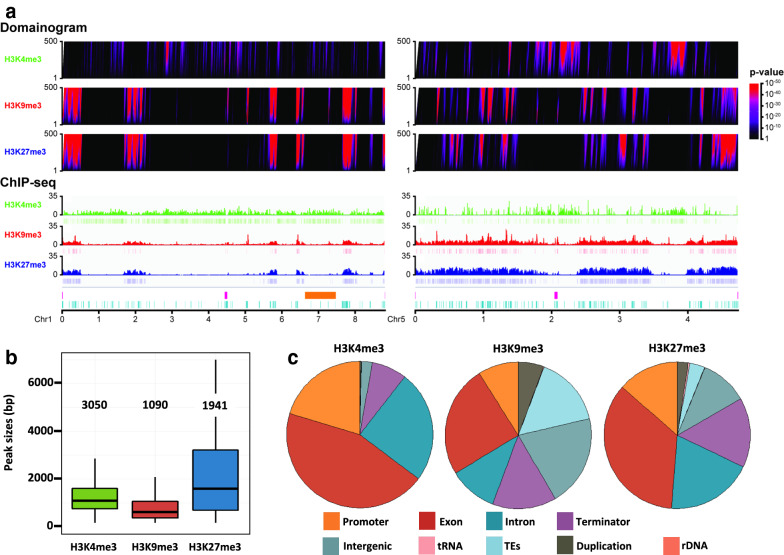
Fig. 2.
Distribution of histone marks in wild-type P. anserina. a Wild-type distribution of H3K4me3, H3K9me3 and H3K27me3 on chromosomes one and five. Domainograms (top) show significance of enrichment of H3K4me3, H3K9me3, H3K27me3 marks in windows of varying size. Color-coding of p-value is indicated (right). ChIP-seq patterns (bottom) display histone modification coverage and MACS2 detected peaks. Both patterns are represented with the same scale on chromosomes one and five of P. anserina. Both centromeres are depicted (pink). The “Mat region” (orange) corresponds to the 800 kbp region devoid of recombination and containing the mating-type locus [93]. Repeated sequences are depicted in light blue. b Peak size distribution in the wild-type P. anserina. Box plots showing sizes (in base pairs) of the MACS2-predicted peak of H3K4me3 (green), H3K9me3 (red) and H3K27me3 (blue). The box is delimited, bottom to top, by the first quartile, the median and the third quartile. Numbers above each box represent the number of peaks detected. Outliers are not shown. c Repartition of histone marks on annotated genome features in wild-type P. anserina. The pie charts represent the proportion of peaks that overlap the genomic features indicated in the legend panel

