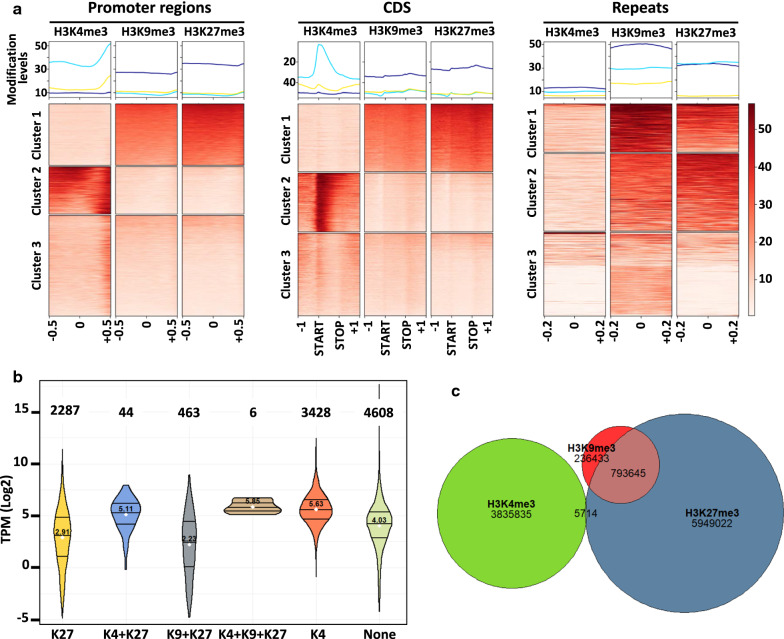
Fig. 3.
Presence of histone marks in promoters, genes and TEs in the wild-type strain. a Metaplots. Top panel: plots of averaged ChIP-seq signal. Bottom panel: heatmaps divided in K-means built clusters representing the association versus non-association of the indicated histone modifications with the specific genomic regions. Promoter regions were defined as 1 kbp 5′ of the start codon ± 0.5 kbp of surrounding sequence (N = 10,835 Additional file 20: Table S2); coding sequences or CDS were aligned by their two ends (indicated by START and STOP) ± 1 kbp of surrounding sequence (N = 10,839 Additional file 20: Table S2); repeats were defined as TE body and duplications and the rDNA array ± 0.2 kbp surrounding each region (N = 1680 Additional file 21: Table S3). Histone modification levels in the heatmaps were calculated for non-overlapping 10 bp windows within the specific genomic regions and sorted by average value of each row. b Violin plots of gene expression according to the histone mark. Gene expression was inferred from the Transcripts Per Kilobase Million (TPM) values calculated in [49]. Log2 of the TPM values was plotted according to the marks detected for the CDS. The three lines of the violin plot represent the first quartile, the median and the third quartile. The white dot and the number above represent the mean. The numbers on top represent the number of genes in each category. K4: H3K4me3, K9: H3K9me3, K27: H3K27me3. C. Euler diagram showing overlap between the different histone marks. H3K4me3, H3K9me3 and H3K27me3 are represented by the green, red and blue areas, respectively. The numbers indicate the number of base pairs covered by each mark, according to MACS2-predicted peaks. Overlap between areas shows the number of base pairs covered by two marks

