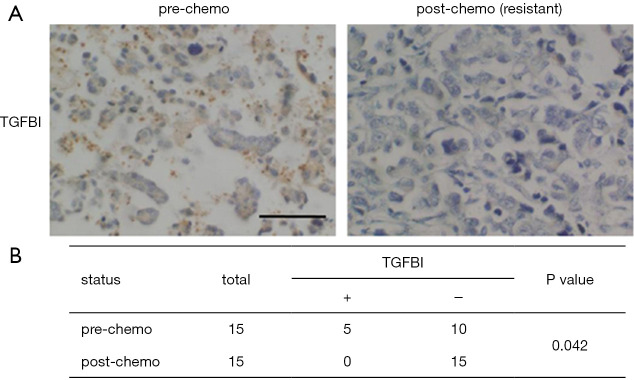
Figure 6.
TGFBI expression was lower in recurrent resistant ovarian cancer samples compared with those of matching primary and pre-chemotherapy samples. (A) Representative images of immunohistochemical staining for TGFBI in pre- and post-chemotherapy samples are shown. Scale bar =100 μm; (B) TGFBI expression information in primary pre-chemotherapy and recurrent post-chemotherapy ovarian cancer patients.

