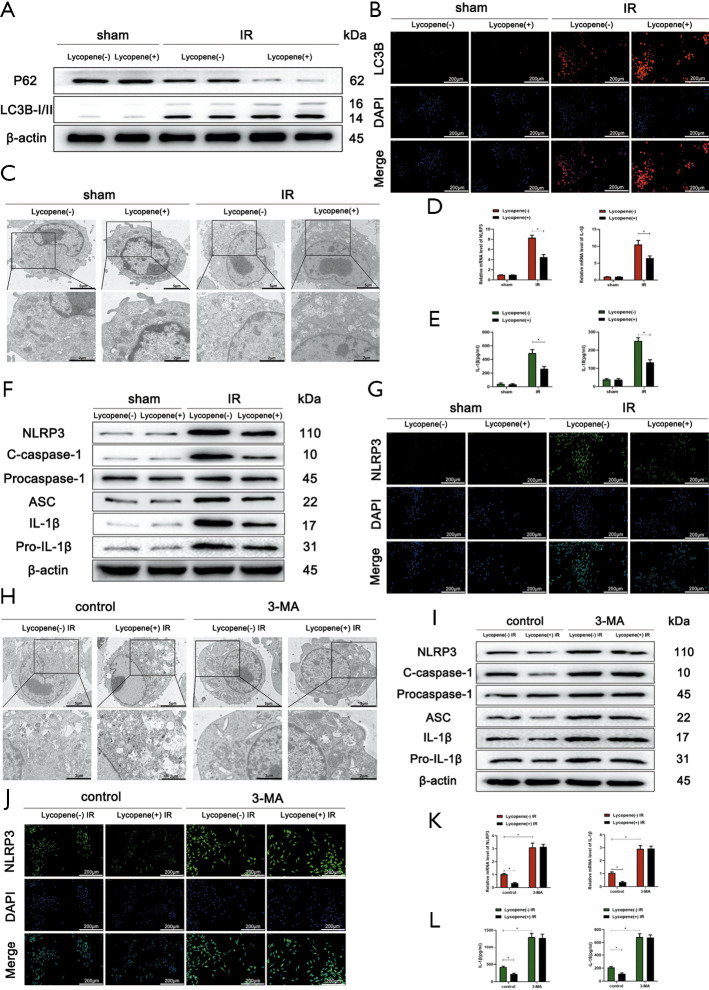
Figure 3.
Lycopene inhibits NLRP3 inflammasome activation in Kupffer cells (KCs) through enhanced autophagy in IR-stressed livers. (A) Western blot analysis of the protein levels of p62, LC3B, and β-actin in KCs isolated from different groups. (B) Immunofluorescence staining of LC3B in KCs isolated from different groups (scale bars, 200 µm). (C) Autophagic microstructures in KCs isolated from different groups detected by transmission electron microscopy (scale bars, 5 and 2 µm). (D) Quantitative RT-PCR analysis of relative mRNA levels of NLRP3 and IL-1β in KCs. (E) Levels of IL-1β and IL-18 in the culture supernatants of KCs isolated from different groups after 6 h of culture measured by ELISA. (F) Western blot analysis of the protein levels of NLRP3, cleaved caspase-1, procaspase-1, ASC, IL-1β, pro-IL-1β, and β-actin. (G) Immunofluorescence staining of NLRP3 in KCs isolated from different groups (scale bars, 200 µm). (H) Autophagic microstructures in KCs isolated from different groups detected by transmission electron microscopy (scale bars, 5 and 2 µm). (I) Western blot analysis of the protein levels of NLRP3, cleaved caspase-1, procaspase-1, ASC, IL-1β, pro-IL-1β, and β-actin. (J) Immunofluorescence staining of NLRP3 in KCs isolated from different groups (scale bars, 200 µm). (K) Quantitative RT-PCR analysis of relative mRNA levels of NLRP3 and IL-1β in KCs. (L) Levels of IL-1β and IL-18 in the culture supernatants of KCs isolated from different groups after 6 h of culture measured by ELISA. All data represent the mean ± SD, *P<0.05.

