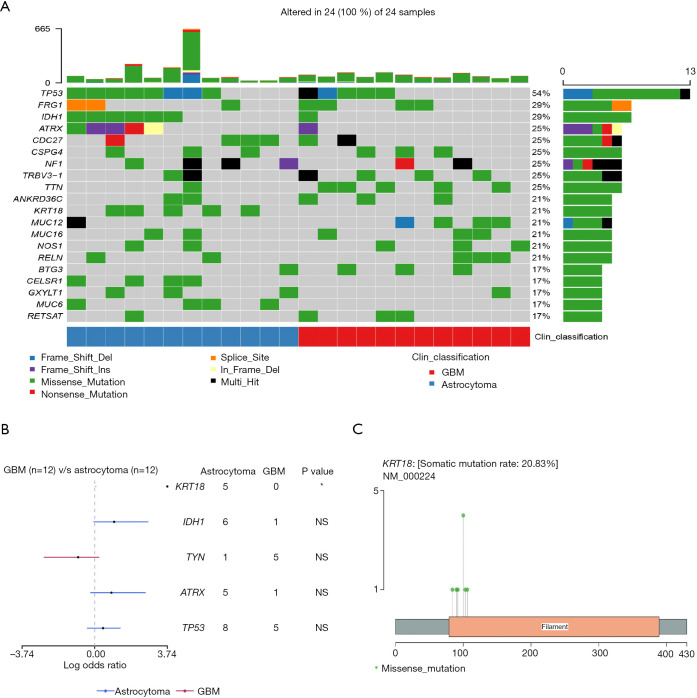
Figure 1.
Genetic mutation profile in astrocytoma and GBM. (A) Overview of the top 20 mutated genes in astrocytoma and GBM. (B) Forest graph of differentially mutated genes between astrocytoma and GBM. The dots and horizontal bars represent the hazard rate and 5–95% CI. (Fisher’s exact test; *: P<0.05). (C) Hot spots of mutations in the KRT18 gene. GBM, glioblastoma.

