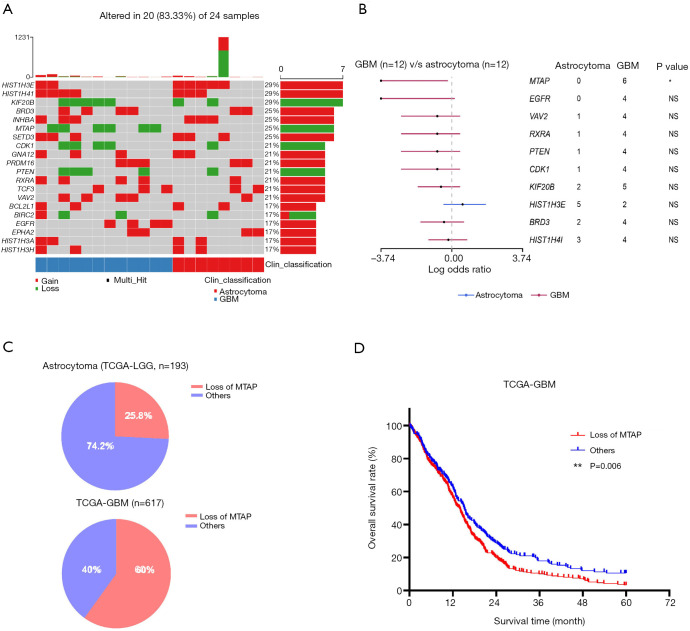
Figure 2.
Differential copy number variations between astrocytoma and GBM. (A) Overview of the top 20 genes with CNVs. (B) Forest graph of CNVs between astrocytoma and GBM. The dots and horizontal bars represent the hazard rate and 5–95% CI. (Fisher’s exact test, *: P<0.05). (C) The proportion of patients with copy number loss of MTAP in astrocytoma and GBM in TCGA database. The 193 patients with astrocytoma were from TCGA-LGG cohort, and the 617 patients with GBM were from TCGA-GBM cohort. (D) Survival of patients with GBM in TCGA-GBM cohort analyzed by the Kaplan-Meier method. The red line represents patients with copy number loss of MTAP. The blue line represents patients with no CNVs of MTAP. The clinical and genetic data were downloaded from TCGA database. **, P<0.01. GBM, glioblastoma; CNVs, copy number variations.

