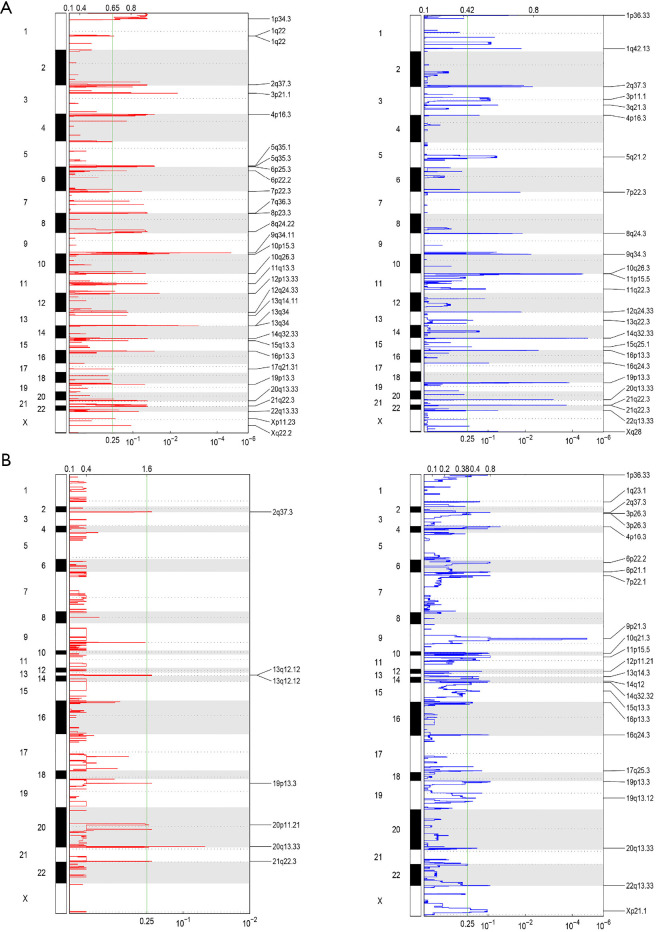
Figure 3.
Different patterns of SCNA in astrocytoma and GBM. Amplification (left, red) and deletion (right, blue) in astrocytoma (A) and GBM (B) were analyzed using GISTIC 2.0. The left y-axes represent the number of chromosomes, and the right y-axes represent the genomic position of altered regions. The top x-axes represent the normalized amplification signal, and the bottom x-axes represent the significance by Q value. The significance cutoff of Q value (0.25) is indicated by the green line. SCNA, somatic copy number alteration; GBM, glioblastoma.

